Behavior data collection
7 ABA Data Collection Metdods
Collecting and analyzing data is a crucial component of Applied Behavior Analysis (ABA). Clinicians and practitioners need data to understand the function of behaviors. They can then use this data to create hypotheses and create intervention strategies.
The primary method for assessing behavior change is through repeated data collection (Najdowski, A. C., et al., 2009). The exact data collection method you utilize to track, analyze, and record all of this data will depend upon your unique goals. For example, teaching new social skills may require different data collection methods than changing education behaviors.
Luckily, there are many data collection methodologies out there to assist ABA professionals in leveraging continuous data collection to achieve positive changes.
Why the Data Collection Method Matters
Clinicians, therapists, and specialists all use data to create actionable behavioral support strategies. Whether you want to decrease negative behaviors (e.g., tantrums, violence, aggression, etc.) or increase positive behaviors (e.g., socialization, sharing, etc.), you need to benchmark the effectiveness of your program. Over the course of your time with a child, you may form multiple hypotheses and adjust your program strategy. That’s fine! In fact, the ability to rapidly shift goals and actions based on incoming data is precisely what makes ABA so incredibly effective at provoking long-term behavioral changes.
But, ensuring that your programs are effective can’t be accomplished with a single data set. There are simply too many variables. Luckily, over the years, ABA specialists and researchers have devised a plethora of data collection methods to help you gather the type of data you need to progress.
7 Common ABA Data Collection Methods
1. Frequency/Event & Rate Recording
The frequency/event and rate recording method involves counting and recording the number of times a behavior happens within a specific time frame. This can be how many times a child bangs their fist against the desk or how many times a student bites their pencil eraser. Frequency/event and rate recording can help clinicians and professionals determine how problematic an issue is and the best course of action to take for a specific behavioral issue. It can also help prove the value (or inadequacy) of treatment models over time.
It’s important to remember that frequency/event and rate recordings are only useful for situations where you wish to measure an event with a distinct beginning and end. It should also only be used to measure behaviors that you can accurately count (i.e., behaviors that are slow enough to measure with precision) and behaviors that only last for a small amount of time (given the window of measurement.) So, if you are working with a child who typically gets aggressive for up to 45 minutes, trying to measure how many times they get aggressive in a 3-hour time frame isn’t going to give you an accurate picture of behavioral changes throughout a therapy model.
- Set up a time frame where you will measure the behavior (e.g., minutes, hours, days, etc.)
- Note the time when the first behavior happens.
- Tally each behavioral tick that occurs until you reach the time frame you originally established.
- Divide the number of behaviors with the total amount of time to get the frequency.
2. Duration Recording
While frequency/event & rate recording can give you insights into the number of behaviors that happen in a time frame, you may want to know how long a specific behavior lasts. Depending upon your goals, the length of time that an action (e.g., tantrum) lasts may be a significant benchmark for your strategy. In this case, duration recording allows you to record how long a behavior lasts.
This method is also useful for behaviors that are too fast (e.g., chattering teeth) or too variable (e.g., tantrums) to count with frequency/event & rate recording. Let’s take a moment to clarify that it is perfectly acceptable (and recommended) to use more than one data collection method. So, you can measure both the rate/frequency of a behavior as well as how long it lasts. The more data you have, the better you understand the behavior, its cause, and your treatments.
- Note the time the behavior first happens.
- Note the time the behavior ends.
3. Latency Recording
To correct negative behaviors and spark positive social change, clinicians may use cues or words to help encourage behaviors. Latency recording involves measuring the time that it takes for a behavior to occur after a verbal cue or an event. For example, you may want to know how long it takes a student to stop talking when you say “quiet down.” Similarly, you could record how long it takes a student to quiet down after you turn off the lights in the classroom.
This method is useful for measuring the impact of verbal cues and events. Let’s say that you’re measuring “quiet down” to help curb a negative social behavior in an extremely talkative child. You want to introduce a communication response that helps halt the behavior, teaching the child boundaries. In this case, knowing how long it takes a child to halt (or begin) behavior at that cue gives you insights into the long-term effectiveness of your strategy.
- Issue verbal cues or events.
- Record how long it takes for the behavior to begin or end after the verbal cue or event has been issued.
4. ABC (Antecedent-Behaviour-Consequence) Data
We measure behaviors to create positive support plans. So sometimes, discovering the cause and effect of behaviors is important, as it helps clinicians and specialists better formulate these support plans. Unlike the above data methods, the ABC method relies on qualified data — not necessarily quantified. ABC data is measured by taking the antecedent (the events that occur before a behavior), the behavior, and the consequences of said behavior.
Remember, observers can only find correlations using ABC data. A hypothesis can certainly be (and usually is) drawn from ABC data. But the data in itself doesn’t prove any functional relationships between A, B, and C. This is a time-consuming data collection strategy that requires plenty of notations and a keen eye for behavioral triggers.
How to Use ABC Data- Prepare to study and watch a specific individual closely for long periods of time.
- When the desired (for studying) behavior occurs, note what happened before (i.e., the trigger) the behavior, what the behavior was, and what the consequences of that behavior were.
5. Scatterplot Analysis
While ABC data can help you draw correlations between triggers and behaviors, scatterplots help you draw correlations between the time of day and behavior on a broader scale. For example, do you want to know if a student hits other children more frequently during art class? To figure that out, you would use a scatterplot.
Scatterplots start by segmenting time into small blocks. For instance, you may want to measure a specific behavior throughout the school day. To start, you would break the day down into 15-minute blocks. Then, you would mark a symbol into the block each time that behavior occurs. At the end of the day, you should be able to see time blocks where there are far more symbols, giving you an indication that the time of day during those blocks may be a trigger.
How to Use Scatterplot Analysis- Use a blank scatterplot analysis paper.
- Mark a symbol in each time block as a behavior occurs.
- Look at the scatterplot at the end of the day to formulate hypotheses for further testing.
6. Interval Recording
All of the data collection methods we’ve mentioned so far share one thing in common — they require constant attention. So what if you’re in a situation where you can’t constantly pay attention and record behaviors? In that case, interval recording can be a massive asset. In interval recording, the entire observation window is split up into blocks of time. Then the clinician observes whether or not a behavior occurs during that time frame.
There are a few variations on interval recording like whole-interval and partial-interval. The primary purpose of interval recording is time constraints. Since frequency/event, ABC, and scatterplots give you better overall insights into behavioral patterns, interval recording isn’t the strongest behavioral data collection method — but it is one of the easiest.
How to Use Interval Recording- Split up an observation window (e.g., 1 day) into smaller blocks of time (e.g., 1 minute every hour).
- Record whether or not a behavior happens during that time.
7. Time Sampling
Another variation on interval recording is time sampling. This method is primarily used by clinicians who are focusing on large groups of in-need students. Time sampling involves splitting large chunks of time (e. g., every 20 minutes) into a bunch of smaller chunks of time (e.g., 1 minute every 20 minutes) and recording the presence or absence of a behavior within or at the end of the interval.
So, let’s say that you’re a clinician seeking to measure the behaviors of a large group of students during a group project. Time sampling allows you to monitor each child independently while also overseeing the entire group over a period of time. Like interval recording, time sampling is not the most robust data collection method, but it’s incredibly useful for specific situations.
How to Use Time Sampling- Set up a large interval and small intervals.
- Every time the large interval passes, check behaviors for the time of the small interval.
Additional ABA Data Collection Methods
- Permanent product
- Rating scale data
- Per Opportunity recording
- Task analysis
Final Thoughts
Your ABA goals are dependent on data. You need a constant stream of incoming data to prove the effectiveness of your programs and discover new avenues of opportunity. With multiple unique data collection methods, clinician and professionals have plenty of options. Whether you need to leverage interval recording in a time-crunched classroom or ABC recording to hyper-focus on an individual student, there is a data collection method out there to help you accomplish your behavioral goals.
Share On Social
Continuous vs Discontinuous Measurement in ABA – Master ABA
The field of Applied Behavior Analysis (ABA) relies heavily on data to make informed treatment decisions. Professionals in the field must choose the data collection method that measures the right behavior. They analyze data to determine the effectiveness of interventions. If the data demonstrate progress, interventions continue. If the data reveal a trend in the wrong direction, the professional changes the intervention.
The right data collection system provides information needed to determine the effectiveness of programming. Choose either a continuous data collection method (frequency, rate, duration, or latency) or a discontinuous data collection method (partial interval, whole interval, or momentary time sampling). The right method provides accurate data that are sensitive to behavior change. Continuous methods provide the most accurate data, although they can be difficult to utilize in busy environments. Discontinuous methods offer an estimate of the occurrence of behavior, but can be used even when staff can’t attend to the learner’s behavior throughout the entire session.
Download this infographic to help you keep this information fresh!
ABA Data Collection InfographicDownload
Contents
Continuous Data Collection
Discontinuous Data Collection
Other Data Collection Methods
Advantages and Disadvantages of Each Type of Data Collection Method
5 Ways to Make Frequency Data Collection Easier and More Discrete
Choose Your Data Collection Method
Download Data Sheets
Related Posts
Continuous Data Collection
Continuous data collection methods measure every occurrence of a behavior.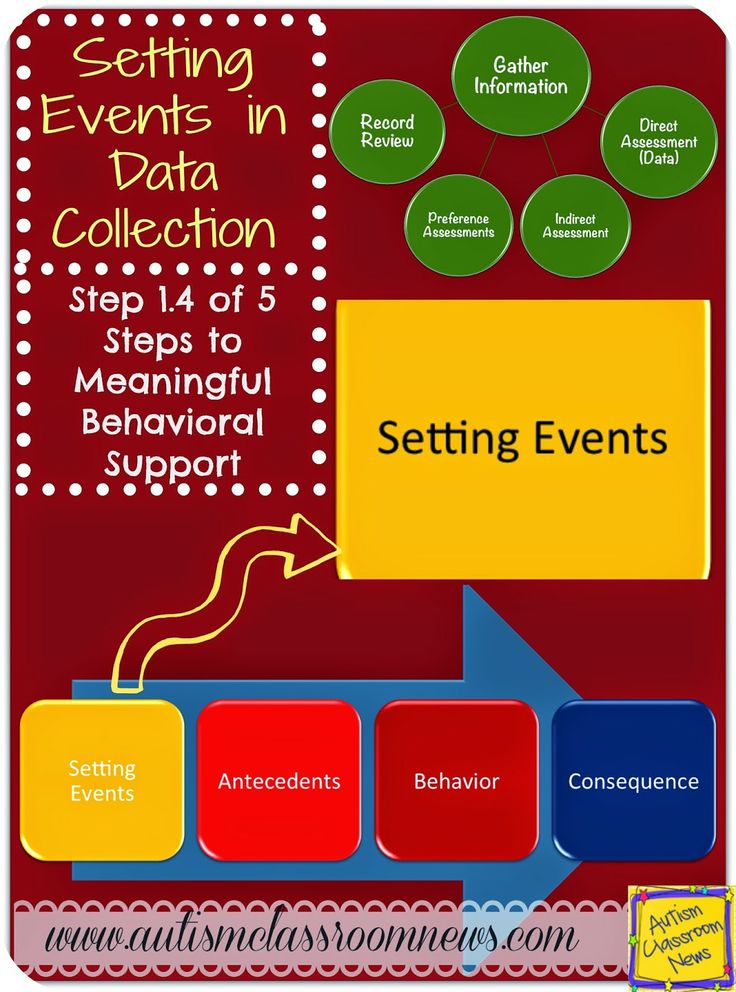 These methods either count each instance of the behavior or the specific amount of time a behavior occurs. These methods allow you to measure behavior along the basic dimensions and accurately detect change in the behavior. Choose a continuous method when programming requires a complete record of behavior. Several different systems provide continuous data.
Frequency
Frequency provides a simple count of the behavior that occurs. Record the frequency of the behavior using tally marks, a clicker, or even small objects. Moving small beads from one pocket to another when a behavior occurs provides a simple way of discretely counting the occurrence of the behavior. Once the session ends, count the number of beads and enter that number onto your data sheet. Use frequency measurement when the behaviors:
- Have a clear beginning and end
- Occur at a rate that can accurately be counted
Frequency measures both desirable and undesirable behavior such as the number of times your client pees on the potty or throws toys. Simple frequency counts are easy for staff to collect; however, they don’t take into consideration how long each session is and can be misleading when session duration varies widely. For example, 10 instances of behavior occurring in a 30-minute session is quite different than 10 instances occurring during a 4-hour session.
Record frequency data using tally marks or use a clicker to count then record the total on a simple frequency data sheet. Download the simple frequency data sheet below to get started.
ABA Frequency Data SheetFrequency Data SheetDownload
Rate
Rate measurements level the playing field regarding session duration. They reflect the frequency of behavior that occurs over a period of time. This type of data provides you with more information than frequency data alone and typically is a more accurate representation of the behavior. To calculate rate, divide the frequency by the duration of the session (i.e. minutes or hours). Rate is expressed as a number per unit of time (i.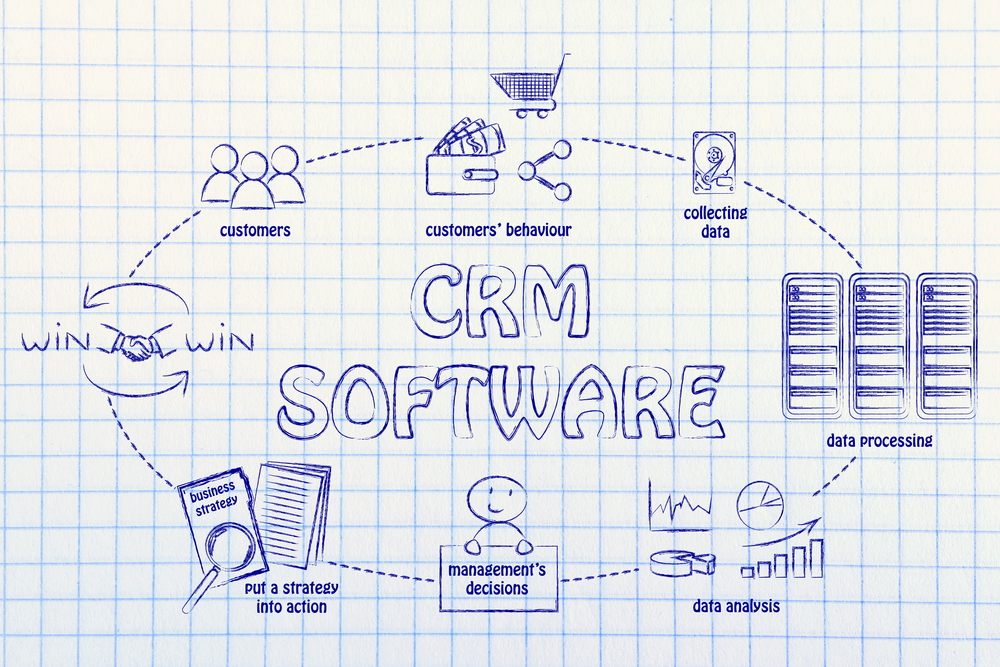 e. 6 instances per hour or 12 instances per minute).
Use rate data when:
- Session duration is inconsistent
- You measure the behavior during some parts of the day but not others
As with other continuous data collection measures, rate data can be used to document behaviors targeted for increase or decrease. You may choose to use rate data to determine the number of times per hour your client mands for something he wants or engages in aggressive behaviors.
Record rate data in much the same way that you record frequency data, but specify the period of time the behavior occurred during (i.e. per minute, per hour, per day, etc.). Download the simple rate data sheet below to get started.
ABA Rate Data SheetRate Data SheetDownload
Duration
Duration data measure how long a behavior lasts from beginning to end. When defining behaviors to be collected by duration recording, professionals must identify an onset and offset to ensure accurate measurement. A stopwatch or timer in a data collection app provides the most reliable duration data. Avoid estimating duration by expecting staff to look at a clock or watch to measure the time. Use duration recording when the behaviors:
- Have ambiguous beginning and end
- Last for an inconsistent period of time
Again, duration could measure both behaviors you want to increase as well as those you are looking to decrease. Amount of time spent engaging in imaginative play or in a tantrum are examples of behaviors you might measure using duration data.
Record duration data by noting the amount of time a behavior occurred during each occurrence. You can also calculate the frequency of the behavior by counting the number of times you recorded the duration. Download the simple duration data sheet below to get started.
ABA Duration Data SheetDuration Data SheetDownload
Latency
Latency measures the time between the discriminative stimuli (SD) and the response. This measure allows you to evaluate the speed of responding to a particular stimulus. For example, you may use latency data to increase the rate of responding during DTT (by decreasing latency) or you may use it to decrease the rate of responding prior to hearing the full SD during DTT (by increasing latency). Use latency data when:
- Responses occur too slowly or too quickly following the SD
Latency measures provide highly specific information. To record latency, initiate the time on a stopwatch following the delivery of the SD and stop the time as soon as the learner begins to respond.
Record latency data by recording the SD and the amount of time it took the learner to begin the response. Download the simple latency data sheet below to get started.
ABA Latency Data SheetLatency Data Sheet Download
Learn more about continuous data collection:
Back to Top
Discontinuous Data Collection
Discontinuous data collection systems measure only a sample of behavior that occurs by breaking the session down into small increments of time. Although these data are potentially less accurate than continuous data collection methods, they are easier to collect in busy environments. There is an inherent error in each method of discontinuous measurement (Fiske & Delmolino, 2012). When choosing a discontinuous measurement method, consider these errors carefully. The chart below describes these errors.
| Discontinuous Measurement Method | Type of Error | Use for: |
| Partial Interval Recording | Overestimates the occurrence of behavior | Behavior decrease |
| Whole Interval Recording | Underestimates the occurrence of behavior | Behavior increase |
| Momentary Time Sampling | Neither overestimates nor underestimates the occurrence of behavior | High frequency, behavior increase |
Partial Interval
Partial interval data breaks the session into equal parts (intervals). Record if the behavior occurred at any point during that interval. Since the behavior only needs to occur once or for a small fraction of the interval, partial interval data overestimates the occurrence of behavior. Use partial interval recording when:
- The behavior does not have a clear start and stop
- The behavior occurs at such a high rate that it’s impractical to attempt to count each occurrence
- An estimate of the frequency of the behavior is acceptable
Keep in mind that because partial interval data provides an overestimate of the occurrence of behavior, you want to use the smallest interval that is practical for your situation. The larger the interval, the more inflated the data. Often, due to the overestimation of this method, professionals use partial interval to document behaviors targeted for reduction. Examples of behaviors you might record using partial interval data include the occurrence of stereotypies or screaming across an entire day, if either behavior occurs at a high rate.
Because staff only need to attend to the behavior if it occurs, partial interval recording can be more efficient for busy staff to collect than monitoring for and counting each occurrence of a given behavior.
Whole Interval
Whole interval data again breaks the session into equal parts (intervals). Record if the behavior occurs throughout the whole interval. Since the behavior must occur for the entire amount of the interval, this method underestimates the occurrence of the target behavior. Use whole interval recording when:
- The behavior occurs over long periods of time
- It’s impractical to use duration recording in your setting
- An overestimate of the behavior is acceptable
Because this method underestimates the occurrence of the behavior you want to use the smallest interval that is practical for your situation to ensure the most accurate reflection of the behavior. Often, due to the underestimation of the occurrence of the behavior, professionals use whole interval to document behaviors target for increase. This might include behaviors such as amount of time spent engaged in table work or functional play, assuming that these occur over significant periods of the child’s day.
Momentary Time-Sampling
Momentary time-sampling takes a quick snapshot of whether or not a behavior occurs. Identify an appropriate interval based on baseline data. When the interval is over, record whether or not the behavior is occurring at that time. This data collection method neither over nor underestimates the behavior; however, because not every instance of the behavior is recorded, the data are far less accurate than continuous data collection. Use momentary time-sampling when:
- Other methods of data collection are impractical in your situation
- You rely on someone else to collect the data who is unable to continuously monitor the behavior due to other responsibilities
- It’s not necessary to ensure you get a complete recording of the behavior
Momentary time-sampling does not provide you with reliable data; however, busy professionals are able to collect data about behavior when they don’t have the ability to attend to the child for extended periods of time.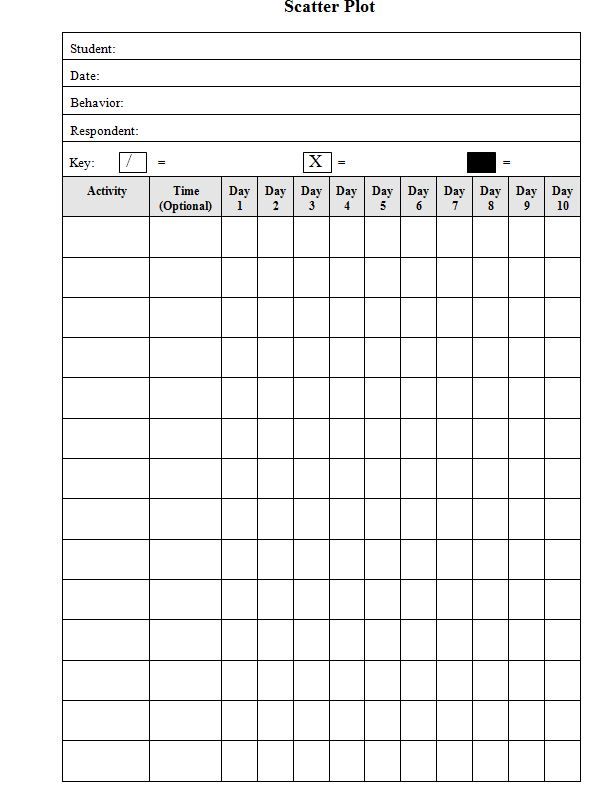 Momentary time-sampling may provide sufficient information for behaviors such as working independently at school or playing alone at home.
Download Discontinuous Data Sheets
Interval data sheetData SheetsDownload
Back to Top
Other Data Collection Methods
The above data collection methods provide the widest application for learning about the occurrence of an identified behavior. The list above meets most of the data collection needs of professionals in the field of ABA. Other methods capture information missed when using those methods. The below data collection systems are used less frequently and for more specific purposes than the methods listed above.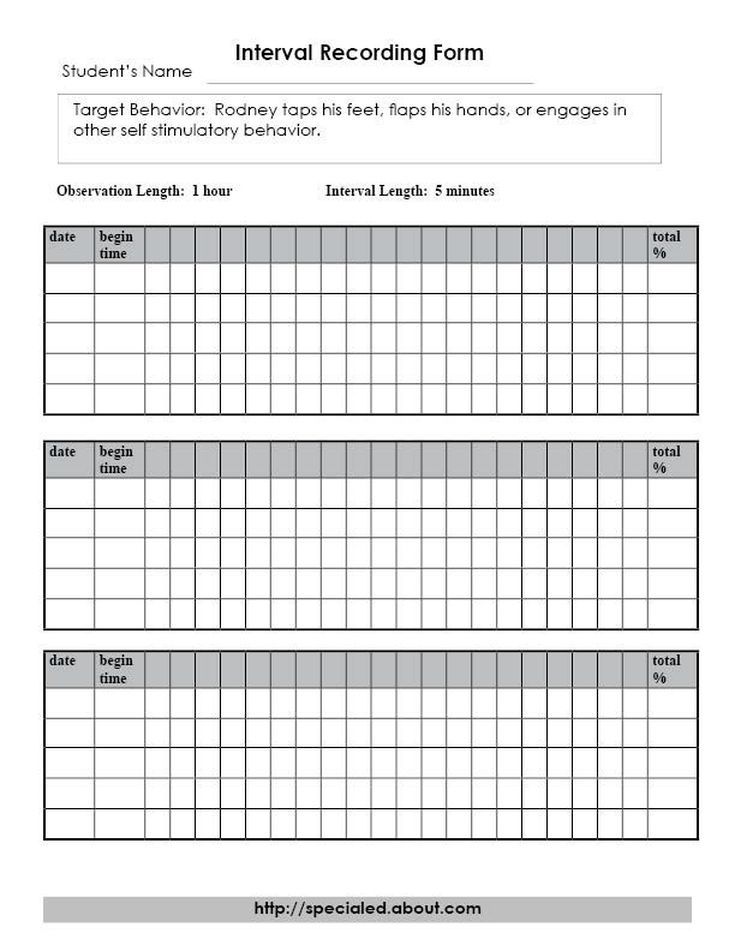
ABC Data Collection
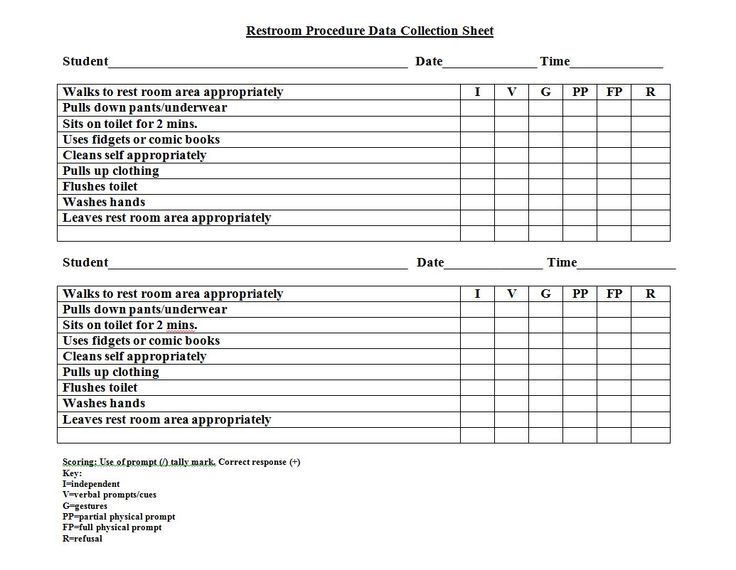
ABC data is often a critical component when conducting a functional behavior assessment (FBA). This data collection method looks at what happens right before and right after the behavior you’re interested in. This allows for analysis of the context of the behavior to begin to determine a possible function. Although there are many ways to collect ABC data, one simple method is to create a form with checkboxes for commonly occurring antecedents, behaviors, and consequences. Not only does this make data collection simpler, but it also provides an easier method for analyzing these data.
ABC data sheetFor more information on ABC data, see our posts: ABC Data: The Key to Understanding Behavior and Functions of Behavior in ABA: Complete Guide.
Scatterplot
A scatterplot provides information of the occurrence of behavior across different parts of the day, either time frames or activities. This method allows for a visual analysis to determine if patterns exist. The example below breaks the day into 1 hour blocks of time and then provides space to compare data across an entire week. This data sheet also provides space to document location. This allows you, at a glance, to see that the highest rate of behavior occurs from 7-8 pm at home. While it doesn’t give you a specific count of behavior, this information allows you to determine when you should look to collect that more specific data.
Blank Scatterplot TemplateDownload
Permanent Product
Permanent product data provides a way for the professional to evaluate the occurrence of behavior after it has stopped. With this method of data collection, the professional does not need to be available to observe the behavior as it occurs. Schools use a lot of permanent product data recording for this reason. A teacher is unable to observe each of her students as they work, but she can look at the permanent products they produce (i.e. worksheets, projects, videos, etc.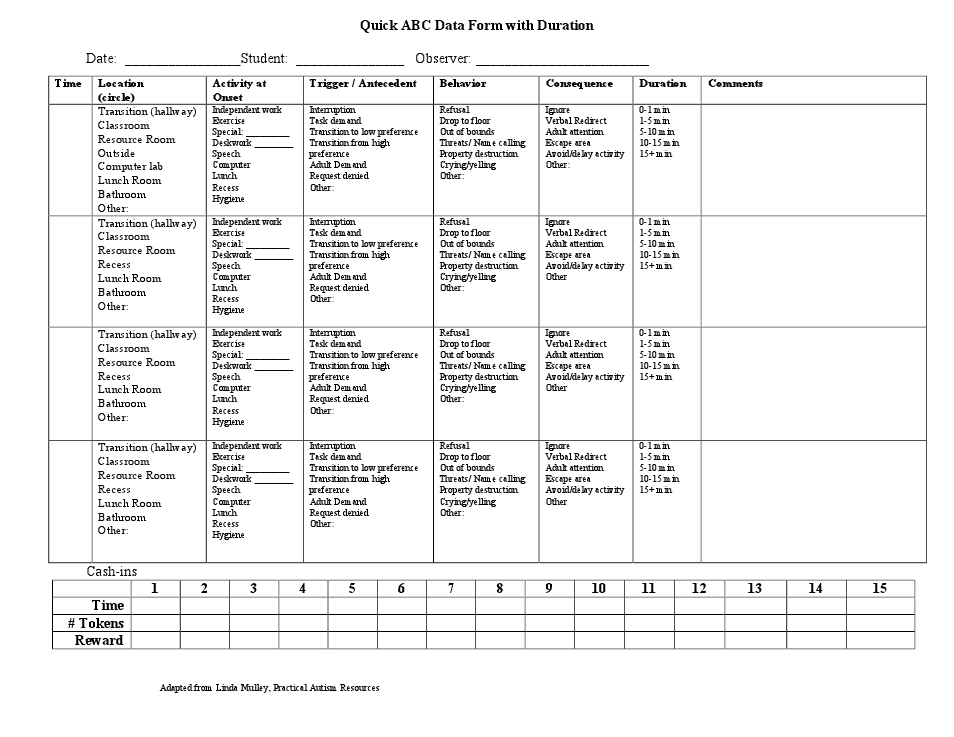 ).
).
Probe
Probe data simply test to determine if a behavior occurs or does not occur in a given situation. In an effort to ensure that data collection does not interfere with teaching methods, a professional may choose to utilize a probe only data collection system for specific targets. If the professional chooses to do a probe prior to any teaching trials, we refer to this as a “cold probe.” Probe data allow for the professional to focus her attention on teaching methodology including errorless learning and prompt fading techniques. This data system is most beneficial when there are a limited number of individuals working with a client and who don’t rely on the data to know the correct prompt level to use during teaching.
Back to Top
Advantages and Disadvantages of Each Type of Data Collection Method
Each data collection method has its own unique advantages and disadvantages. Consider these carefully before determining which system to use.
| Advantages | Disadvantages | |
| Continuous Data Collection | ~Most accurate ~Sensitive to small changes in behavior | ~Requires constant observation ~Difficult to use without 1:1 staff |
| Discontinuous Data Collection | ~Easier to use in a busy environment ~Provides enough information for many situations ~Able to track very high frequency behavior | ~Only an estimate of behavior ~Must consider over or under estimation when analyzing data ~May need more time to see changes in behavior |
Back to Top
5 Ways to Make Frequency Data Collection Easier and More Discrete
Identifying the obstacles to accurate data collection helps reveal creative solutions to over come them.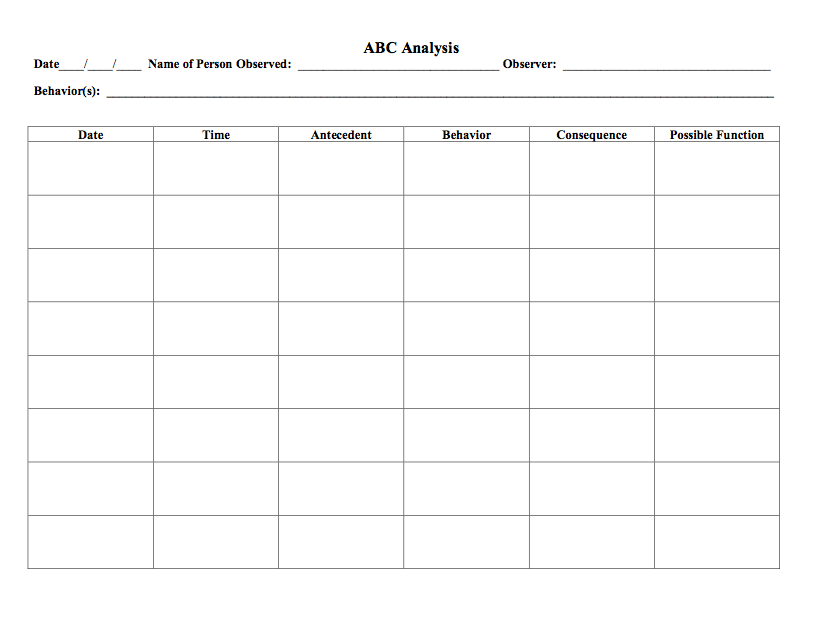 While you may experience specific obstacles in your practice, two obstacles seem to occur across various types of ABA programs. Often staff have the most difficulty in accurate data collection when they need to collect frequency data for high frequency behaviors or when the act of collecting the data becomes reinforcing for the child.
High Frequency Behaviors
Many children with autism engage in a variety of maladaptive behaviors that occur at too high a rate. Often behavior change occurs gradually over time. In order to determine the effectiveness of a behavior reduction plan, the data that are collected must be accurate. Although frequency and rate data collection may not be the most practical method for collecting data for high frequency behaviors, it is the most sensitive to behavior change, provided that the data are accurate.
Data Collection Becomes Reinforcing
Many children with autism don’t pay attention to data being collected by a professional. Other children find any form of attention motivating.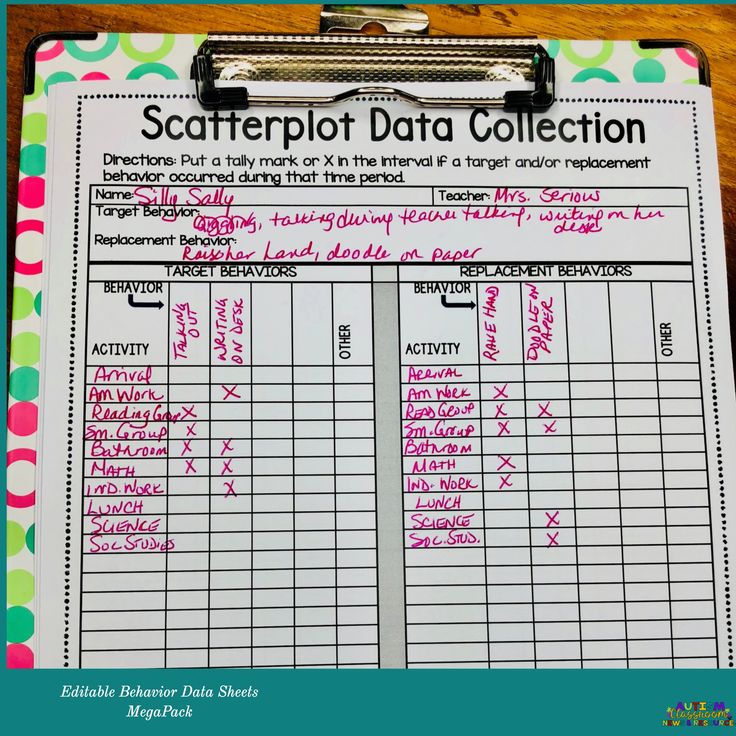 When these children associate their behavior with the behavior of staff, the result may be an increase in this behavior. Traditional data collection techniques require staff to distinctly make some type of mark or electronic record. These methods lack the subtlety needed for children attuned to staff behavior.
Data Collection Techniques
Here are 5 options for easier and more discrete data collection. Each of these techniques offers its own unique advantages and disadvantages. Try them and see what works best for you!
1. Clicker Counters
Clicker counters are a great tool for counting high frequency behaviors and can easily be used to calculate rate (just calculate frequency/time). These clickers are a great way to track a variety of behaviors that occur frequently. You simply assign each behavior a color and click when the behavior occurs. They include a hook that you attach to a carabiner so you can attach them to a pocket or belt loop. These are affordable and available on Amazon
. Their major disadvantage is the clicking sound that they make. Avoid these for children whose behavior is reinforced by staff collecting data.
Alternatively, digital finger counters provide the subtly you may need, but these counters can be sensitive and you risk counting behavior that doesn’t occur. If worn on a thumb, you may be less likely to accidentally hit the button. Again, these handy tools are inexpensive and easy to find on Amazon
.
2. Small Objects in Pockets
Check out this low-tech option for tracking the occurrence of behavior. Put a collection of small objects in one pocket. As behavior occurs, transfer the corresponding number from that pocket into the other pocket.
This method offers some subtlety for well trained staff. To optimize discretion, staff put their hand in their pocket and carefully scoop one item into their hand as behavior occurs. Once the child looks away, staff move the items from that pocket to the other. The more frequently the behavior occurs, the smaller the objects must be.
With this option, you risk accidentally dropping the items either back into the original pocket or on the floor when transferring them. In addition, you must count each item at the end of the session. While this creates additional work, it may be the best short-term option if you need a low-tech, discrete data collection method.
3. Beads on a Pipe Cleaner
Sliding beads on a pipe cleaner offers another low-tech option for frequency data collection. When done well, it appears as though staff are simply fidgeting with the beads or doing a craft while not attending to the child’s behavior. Staff can slide a group of beads onto the top of the pipe cleaner and as behavior occurs, slide the beads to the bottom.
While this option may be reinforcing for staff as it can offer a calming effect for some, children may pick up on the fact that each time behavior occurs, staff pick up the beads. There are 2 ways to combat this effect: rotate between different low-tech options or have staff play with the beads throughout the day when behavior does not occur.
4. Technology
Technology offers a broad array of options from simple to complex. Many apps provide access to different methods to tally behavior as it occurs. Some apps export or graph this data for you as well. A simpler option is to open a note taking app and add an emoji or other character each time the behavior occurs.
Similar to the small objects method, this method requires staff to count the occurrences at the end of the session. This method offers some other nice advantages for children who attend to staff behavior. Adults on technology (phones, tablets or computers) is so common place that it essentially becomes unnoticeable to many children. In addition, children who are motivated by technology may be unpleased to see that the adult has found her own entertainment while he engages in the behavior.
5. Small Elastics on Fingers
A final low-tech and inexpensive option is to place small elastics on your fingers (hair elastics intended for young children work well). Place spares on one hand and as behavior occurs, roll them over to the other hand. To the child, this may appear as simple fidgeting.
This method may be inefficient for behaviors that occur at a very high frequency. In addition, some staff may find them uncomfortable on their fingers. This system also requires staff to count each elastic at the end of the session. Despite these disadvantages, you may find that this method works best for your specific circumstances.
Back to Top
Choose Your Data Collection Method
The data collection method you choose must produce accurate data, measure outcomes, and be sensitive to change in the behavior measured (Fiske & Delmolino, 2012). Many factors influence the accuracy of data collection, including the:
- Operational definition
- Training of interventionists
- Type of data collection system selected
For more information about writing clear operational definitions, check out our course Writing Operational Definitions.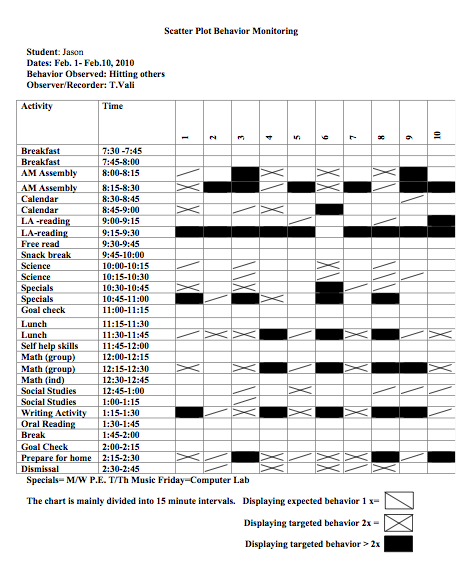
Research in Data Collection Methods
Several studies evaluate the use of the different data collection methods in research studies. Two studies evaluate this trend during different time periods. Kelly (1977) looked at the research published in The Journal of Applied Behavior Analysis from 1968-1975 and Mudford, Taylor, and Martin (2009). The results of their research are presented in the table below.
| Time Period | Continuous Data Collection Methods | Discontinuous Data Collection Methods |
| 1968-1975 | 59% | 41% |
| 1995-2005 | 55% | 45% |
Across the 40 year span from the start of the first study to the end of the follow-up study, researchers balanced the use of continuous and discontinuous data collection methods. Although discontinuous data collection methods have their value, they fail to quantify the basic dimensions of behavior (Fiske & Delmolino, 2012).![]() With the introduction of electronic data collection systems, continuous data measures are more practical and efficient than they were when only paper and pencil technology existed. Although this should lead to researchers relying more on continuous data collection measures, the studies reveal that it’s not necessarily the case.
With the introduction of electronic data collection systems, continuous data measures are more practical and efficient than they were when only paper and pencil technology existed. Although this should lead to researchers relying more on continuous data collection measures, the studies reveal that it’s not necessarily the case.
Factors to Consider When Choosing a Data Collection Method
When determining which data collection method fits your needs, you must consider many factors including:
- Is the behavior potentially dangerous?
- Does the behavior threaten the placement of the individual?
- How frequently does the behavior typically occur?
- Does the behavior occur over a period of time?
- Does the behavior have a clear beginning and end?
- Who will be collecting the data?
- How long does the behavior usually last?
- Is it a behavioral deficit or excess?
Fiske and Delmolino (2012) provided clear guidelines for choosing between a continuous and discontinuous data collection method. The table below is a description of their recommendations.
| Continuous Data Collection Method | Discontinuous Data Collection Method |
| Discrete behaviors with a clear onset and offset | Ambiguous breaks between the occurrence of the behavior |
| Interventionist can accurately record each instance | The behavior occurs at a very high rate |
| Recording behaviors individually | Recording multiple behaviors simultaneously |
| Interventionist responsible for 1 learner | Interventionist required to complete many tasks at once |
Serious, dangerous or severe behavior requires a system that provides accurate data. Strongly consider using continuous data collection when addressing these types of behavior. Behaviors that occur at an exceptionally high rate may require a discontinuous data collection method for accuracy. If you rely on parents or teachers to collect data, you should consider discontinuous methods. Taking all of these factors into consideration allows you to select the most effective and efficient data collection system for your ABA program.
Back to Top
References and Further Reading
Fiske, K., & Delmolino, L. (2012). Use of discontinuous methods of data collection in behavioral intervention: Guidelines for practitioners. Behavior Analysis in Practice, 5(2), 77-81.
Kelly, M. B. (1977). A review of the observational data‐collection and reliability procedures reported in the Journal of Applied Behavior Analysis. Journal of Applied Behavior Analysis, 10(1), 97-101.
Mudford, O. C., Beale, I. L., & Singh, N. N. (1990). The representativeness of observational samples of different durations. Journal of Applied Behavior Analysis, 23(3), 323-331.
Mudford, O. C., Taylor, S. A., & Martin, N. T. (2009). Continuous recording and interobserver agreement algorithms reported in the Journal of Applied Behavior Analysis (1995–2005). Journal of Applied Behavior Analysis, 42(1), 165-169.
Repp, A. C., Roberts, D. M., Slack, D. J., Repp, C. F., & Berkler, M. S. (1976). A comparison of frequency, interval, and time‐sampling methods of data collection. Journal of Applied Behavior Analysis, 9(4), 501-508.
We collect data about the behavior of customers on the site / Habr
In the previous article, we figured out how to make personalized offers on the website of an online store. Today we will tell you how to collect data about the behavior of its visitors, in order to then build reports on the sales funnel, catch up with “abandoned carts” and select product recommendations. Let's see why simple web analytics is not enough for high-quality personalization and how to better understand your customer using SAS Customer Intelligence 360.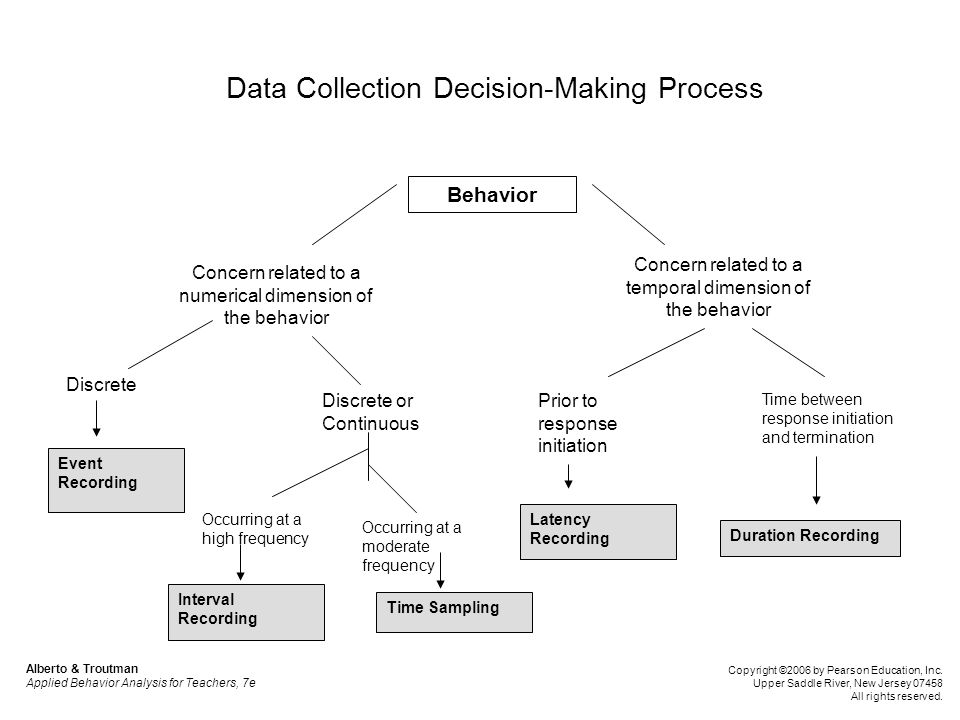
The most popular tools for analyzing user behavior on the site are free Google Analytics and Yandex.Metrica. For them to work, the site owner must place a JS code (more often called a tag) on the site, mark the main stages of the sales funnel and set up sending data about the events committed by users. After that, reports on viewed products, purchases made, pages visited, user geography, etc. will be visible in Analytics and Metrica.
The main disadvantage of the free versions of Google Analytics and Yandex.Metrica is that the data in them is aggregated, and sometimes even sampled. The site owner only has general information about what is happening in his online store: how many users are at each stage of the sales funnel and what products are viewed and purchased.
This is enough for a novice Internet seller. But if you have increased sales volumes, collected an extensive database of information on customers and now want to send them effective personalized offers, then generalized data for all users is no longer enough.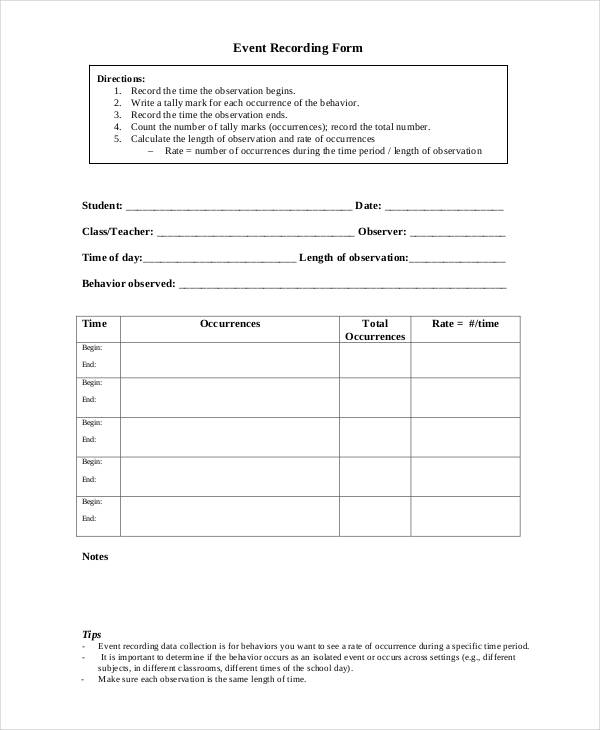 You need to delve into the level of each user: see what products he views, puts in the basket and buys, analyze his behavior. SAS Customer Intelligence 360 (or simply "CI 360") helps solve this problem.
Let's see how to work with it. When using CI 360, you will be required to place a special tag on the site pages (for example, by placing it in the header), and then set up e-commerce events in the graphical interface.
Let's take a look at the main steps in setting up the collection of data about the behavior of site visitors using the SAS Store demo store as an example. Let's create rules to track product view, add to cart, and cart view events, and define what information to get from them. CI 360 allows you to set up more shopping view and checkout view events. This is done in the same way as setting the cart view event.
Customizable e-commerce events
Customize product view event
Let's create a product view event and define what data we need to get from it. Typically, for online stores, all product pages share a common URL template and page HTML code. The SAS Store site is no exception - a typical product page looks like this:
Product page on the site
Common attributes for products are: product identifier, product name, product group name and price. Let's set up the collection of information about these attributes in CI 360.
Let's create a product view event in the interface and set a template for product pages — we define the domain, the URL path. The product page is defined by the route and product_id query parameters. For the product_id parameter, we set the rule using a regular expression, which matches any non-empty sequence.
Product page identification settings tab
Next, you need to specify how the values of the data received from this event will be filled. They can come from elements on the page, a URL (domain, query parameter, or cookie), or information about the page—say, the value of a JavaScript variable or the title of the page.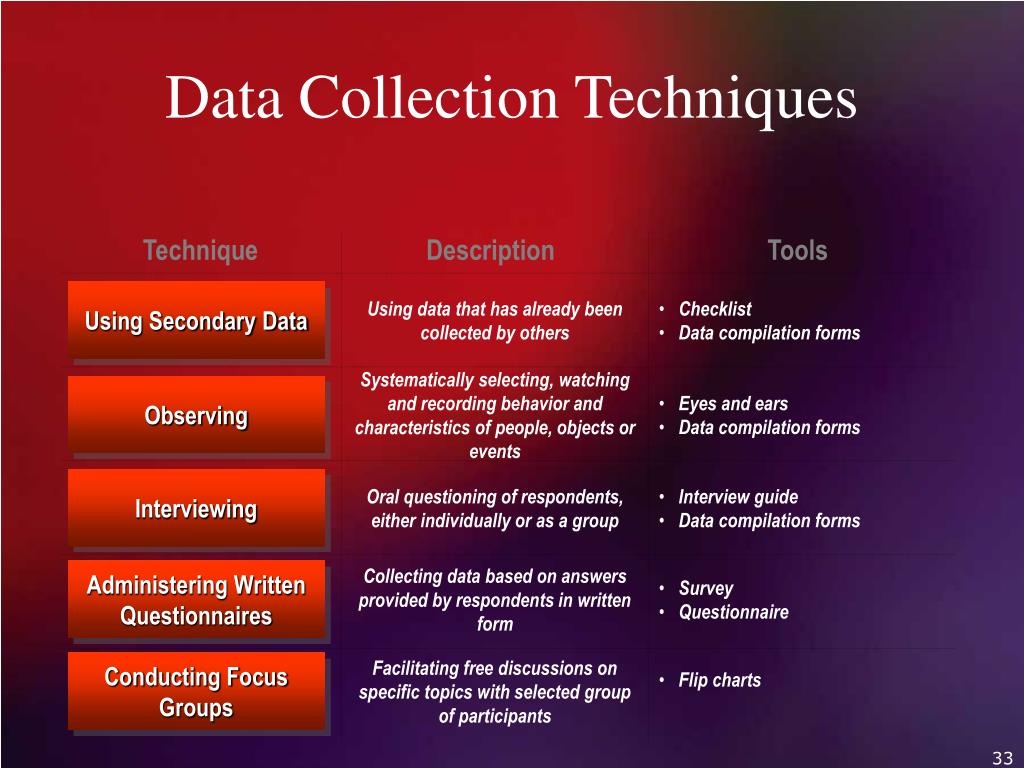
Product Attribute Population Setting
The product ID is collected from the product_id parameter in the URL. The rest of the information is taken from the product page. To do this, you specify the element selector from which you want to collect data. You can also specify what to extract - the whole text or part of it. For example, for the "product price" attribute, take the value up to the ₽ symbol.
In addition to these attributes, you can define the following: product SKU, product availability message, product delivery message, and product quantity message if available on the page. If you need to collect more information about a product, then CI 360 can be configured to collect additional data from pages that can later be combined.
Add product to cart event setting
Add to Cart event data collection can be configured on a form submission or button click action. For the SAS Store site, you should configure this rule on button click.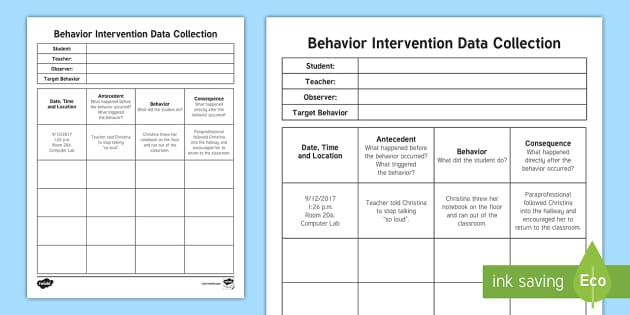
To do this, a template for the product page is set in the interface, then the selected page is opened in the interface and the object for clicking is selected with the mouse - the "Add to Cart" button, after which it will be highlighted in blue.
Selecting an object for a click
Similarly with product attributes, attributes are defined for the add to cart event. Only the attribute of the quantity of the added product is added to them, which is taken from the product page from the "Quantity" field.
When adding an item to the cart, an error may occur: for example, the user did not specify a size, or a message was displayed that the item was out of stock or no longer available. In this case, the product will not actually go into the basket. You can define an event that CI 360 considers an error adding an item to the cart. It can be configured on events of changing the content of the site page or a JavaScript variable.
Add add to cart error event
Configure cart page view event
This event should fire when the user views the cart page. Let's take a look at the cart page on the site and determine what data we need to collect from this event. Then we will create a cart view event in the interface.
Cart view page on the site
Let's deal with the attributes of the event. After all, different users may have a different number of products in the basket, how then to set information about the contents of the basket?
Usually all products are listed in some table on the page, and in the CI 360 interface, you need to specify a selector for one such row with the product in the basket. CI 360 will then automatically find the remaining rows in the product table and collect data from them.
Set the collection of data about the name of the product in the basket, its price and quantity. Also, for the basket, we will determine the cost of delivery, the total price of the goods in the basket, and the city of delivery. Defining the elements from which data will be collected is similar to how it was done in setting up the product view event.
After saving and publishing the created rules, the data is collected into the CI 360 data model. It has three tables that contain data about e-commerce events. They can be downloaded for further analysis.
Table with information about product views
Table with detailed information on products in the shopping carts of site visitors
Table with summary information on cart views right there, in the studio interface. For example, they show which products people viewed and added to their shopping cart, which ones they then bought, and which ones they didn’t.
Ecommerce report. Graph by product views and cart start
Ecommerce report. By product group, you can view statistics on product views/product purchases
Using CI 360, we were able to quickly set up rules for collecting product views and shopping cart data. Of course, the solution provides a set of standard user behavior reports (including e-commerce data) out of the box by default. But you can also set up your own reports, for example, on the sales funnel, as well as monetize the insights received - catch up with "abandoned carts" and use this data to select product recommendations. How exactly? We can talk about this in one of the following articles - subscribe to updates so as not to miss it.
how to organize data collection - Carrot quest blog
In the first part of this material, we talked about what events are in user analytics, why they are collected and how data collection works.
Now let's figure out what events you need to collect in order to get high-quality analytics about user behavior in a product, website or mobile application
Determine why you need analytics
What are you and your team working on? What is your end goal? Think about the business goals you need to achieve.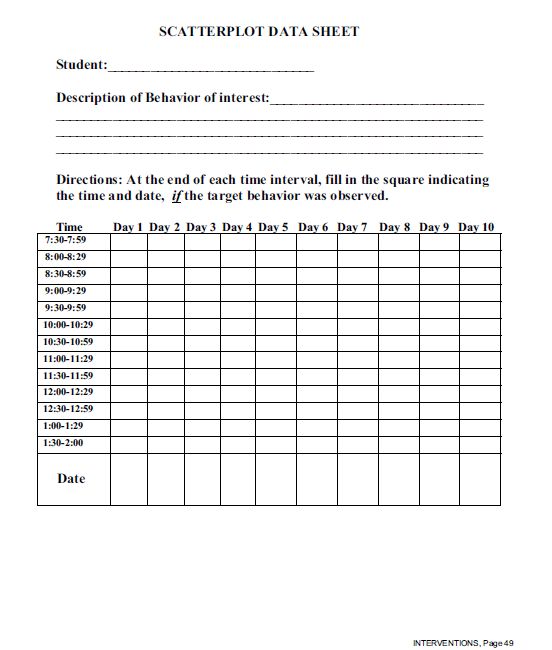 Once you have identified your main goal, decide how you will work towards achieving it. Determine the KPIs and metrics you need to focus on in order to achieve your goal.
It is very important to define goals and objectives before organizing the data so that you can be sure that you are collecting the right events.
Example:
Suppose you have a movie streaming service and your global goal is to increase conversion to payment.
Your metrics can be: retention rates for paying users and checkout funnel conversion rates.
In this case, you will have a special priority for events related to purchases and data on paid users.
Highlight the main paths in the product that match your goals
A path is a set of actions that a user takes. Your task is to determine the most popular paths the user takes in the product to achieve their goals.
All user paths lead to the final point for the client or business. Let's return to our movie service. We can track user events from their first visit to the page to paying for a subscription, because this path leads to a purchase.
In this case, the user's path can be as follows: Went to the site - registered - paid for a monthly subscription.
You can break this path into a series of events that are important for us: "Entering the site", "Viewing the page with new products", "Entering the pricing page", "Selecting a subscription", "Registration", "Payment".
Try to follow only those events that are necessary to achieve your business goals. You can always add more events later if needed, but remember that then you won't have a retrospective picture of how a particular section or button was interacted with before data was collected on it.
Create a data collection plan
Based on the user journey, determine which events to collect within the product. Keep in mind that some data will be important for the marketing team, and others for support.
At first it may seem that it is better to collect absolutely all the data, but in reality it is not so - too much data can only bring chaos to the analytics, and it will be too difficult to find useful information. Collect only really necessary data on events and users.
We know which way the user goes to subscribe. It is important for the marketing team to get the user's contact, and for the product it is important for the user to switch from the trial to a paid subscription.
Example:
In a streaming service, the most important events will be: “visited the site”, “registered”, “signed up for a trial”, “added a card number”, “choose a tariff”, “watched a movie”, “watched 10 films”, “choose a subscription”, “paid for the first month”, “paid for the second and subsequent months”.
Set user properties and event properties
Some events and users contain properties. The "Playing song" event inside a mobile application can contain several properties - the name of the song, genre or artist.
Selecting user properties and event properties can give you more insight into the behavior of your clients when they interact with the application.
User property describes the attributes of an individual user using your application (age, gender, location).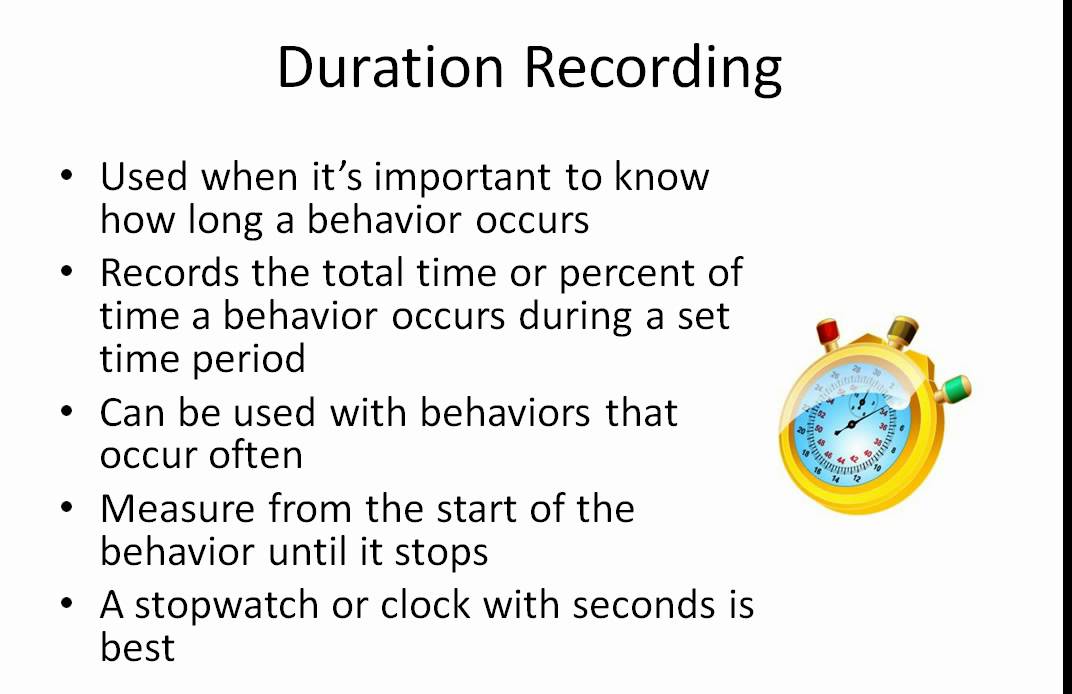
Event property describes the characteristics of the event (on which page the event occurred, time, duration).
The event has a date and time of occurrence and cannot be overwritten. A property is a characteristic of an event.
Example:
User properties can be: country, language, time zone, gender, age. And the properties of events are the time of payment for the subscription, finished watching the movie or not, watched in English or watched with subtitles.
To keep events and properties in one place and easy to find, many companies record them in Google Spreadsheets. Such tables serve as a catalog for collecting data and help you find the right event or property at the right time.
Behind every great analytics is a great event categorization - how you organize groups of events and properties that are used to define user actions within a product.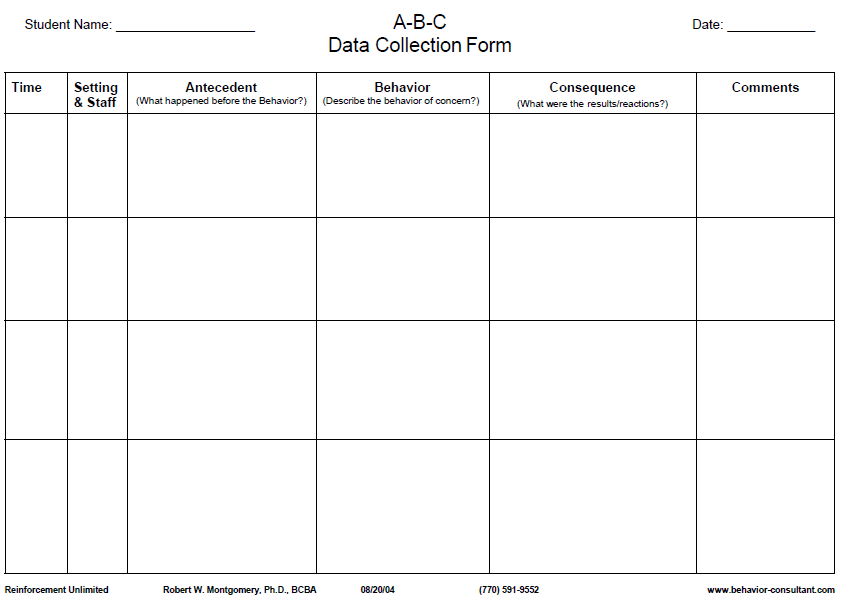 Event classification is the basis for all future analytics.
All events must be named according to a certain pattern, so that you do not have two different registration events: "Sign up" and "sign up".
Event classification exampleCollecting all events and properties for a streaming service in one table so that we can access each of them in the future.
Don't forget about user identification
Most analytics platforms require additional authentication settings - login, email or user ID - to track unique users and those who have already logged into the application. This feature allows you to merge user data from multiple devices and sessions into one user. Therefore, it is important to make sure in advance that the user ID does not change.
Example:
Irina is registered in our movie service.
Thanks to the glued data, we can now see what Irina is doing in the mobile app and laptop.
ID helps to recognize the user in order to record data about him or perform actions with him. Therefore, it is extremely important that throughout the entire life cycle of the user, the user ID remains unique and does not change. If you use your parameters as a user ID (for example, email), then make sure that the data will not change.
Take care of cross-platform analytics
If your product is implemented on multiple platforms, such as web and mobile, you will need glued analytics for them. Let's say you want to know what your user is doing on the site and why they switch to a mobile application, then you just need analytics for the same user from two platforms.
Example:
Our streaming service has three platforms: web, smart TV and mobile app. And we need glued user analytics from all sites.
Check if all events are collected correctly
After you have decided on data collection, set up all events and launched analytics, you need to check if it works correctly. To do this, you can check how events and properties are recorded by going through the user's path in the product.