What percentage of people get divorced
Divorce Statistics and Facts | What Affects Divorce Rates in the U.S.?
If you spend enough time perusing the internet, you’ll find no shortage of studies, statistics, facts about divorce.
There seems to be a study looking into almost every possible factor that might affect marriages and lead to divorce. These studies have yielded some extremely interesting and – in some cases – downright shocking information about divorce in both the United States and the rest of the world.
Just in case you don’t have 20 hours to spare (it may or may not have taken this long to create this list), we have compiled a nearly exhaustive list with every divorce statistic, study, and fact that we could find. As we move into 2022, our San Diego divorce lawyer team has provided everything you need to know – and quite possibly more- about divorce.
COVID-19 Pandemic Divorce Statistics
As a result of the COVID-19 pandemic and varying states of lockdowns all over the United States and the World, we may be in for the largest single-year increase in divorce in decades. We will keep track of any reports and data that come out over the next year and report here.
What we know so far:
- Jurisdictions all over the world and in nearly every city in the U.S. have reported significant increases in domestic violence.
- Relationships experiencing problems are likely being stressed to the point of breaking by factors such as the lockdown, financial strain and political discord.
- We won’t have a full picture of the fallout until 2021 at the earliest.
U.S. Divorce Rate
U.S. Divorce and Marriage Rates by Year
1. In 2019 (the latest data available), the marriage rate in the United States was 6.1 per 1,000 total population.
2. In the same year, the divorce rate was the U.S. is 2.7 per 1,000 population (with 44 states and D.C. reporting) This is known as the “crude divorce rate”. Although useful for describing changes in divorce rates over time, the crude divorce rate does not provide accurate information on the percentage of first marriages that end in divorce.
3. As of 2019, both marriage rates AND divorce rates in the US are decreasing – with the marriage rate dropping from 8.2 per 1,ooo people in 2000 to 6.1 and the divorce rate from 4.0 in 2000 to 2.7. Recent studies have shown that millennials are choosing to wait longer to get married and staying married longer and are the main driver in the decline of both the marriage and divorce rate in the US.
U.S. Divorce Rate per 1000 Married Women
4. Currently, the divorce rate per 1000 married women is 16.9. Many experts feel that this is a much more accurate measure of true divorce rate than the crude rate.
5. The divorce rate per 1000 married women is nearly double that of 1960, but down from the all-time high of 22.6 in the early 1980s.
6. Almost 50 percent of all marriages in the United States will end in divorce or separation.
7. Researchers estimate that 41 percent of all first marriages end in divorce.
8. 60 percent of second marriages end in divorce.
9. 73 percent of all third marriages end in divorce.
10. The United States has the 6th highest divorce rate in the world. Here is a chart of the top twenty:
Countries with the Highest Divorce Rates in the World: Top 20
How Often Divorce Takes Place in the U.S.
(This information was recalculated based of newly released divorce figures from the CDC for the year 2019. The true figures are likely higher, as the release only includes data from 44 reporting states)
11. Every 42 seconds, there is one divorce in America, That equates to 86 divorces per hour, 2,046 divorces per day, 14,364 divorces per week, and 746,971 divorces per year
12. Every 16 seconds, there is a marriage in the U.S. That equates to 230 marriages per hour, 38,762 marriages per week and 2,015,603 per year.
13. There are nearly 3 divorces in the time it takes for a couple to recite their wedding vows (2 minutes).
14. More than 172 divorces occur during your typical romantic comedy movie (2 hours).
15. 430 divorces happen during the average wedding reception (5 hours).
16. There are 5,975,768 divorces over the course of an average first marriage that ends in divorce (8 years).
17. Over a 40 year period, 67 percent of first marriages terminate.
18. Among all Americans 18 years of age or older, whether they have been married or not, 25 percent have gone through a marital split.
19. 15 percent of adult women in the United States are divorced or separated today, compared with less than one percent in 1920.
20. The average first marriage that ends in divorce lasts about 8 years.
Median duration of first marriages that end in divorce:
Males: 7.8 years
Females: 7.9 years
Median duration of s
econd marriages:Males: 7.3 years
Females: 6.8 years
21. People wait an average of three years after a divorce to remarry (if they remarry at all).
22. In 2011, only 29 out of every 1000 of divorced or widowed women remarried.
Who is Getting Divorce, When, and Why?
Who is Getting Divorced?
23. The average age for couples going through their first divorce is 30 years old.
24. 60 percent of all divorces involve individuals aged 25 to 39.
25. Wives are the ones who most often file for divorce at 66 percent on average. That figure has soared to nearly 75 percent in some years.
26. 5 Professions with highest divorce rates:
- Dancers – 43
- Bartender s- 38.4
- Massage Therapists – 38.2
- Gaming Cage Workers – 34.6
- Gaming Service Workers – 31.3
27. 5 Professions with lowest divorce rates:
- Farmers – 7.63
- Podiatrists – 6.81
- Clergy – 5.61
- Optometrists – 4.01
- Agricultural Engineers – 1.78
U.S. Divorce Rate by Occupation
Data comes from the
| Occupation | Divorce Rate |
|---|---|
| Dancers | 43 |
| Bartenders | 38. 4 4 |
| Massage Therapists | 38.2 |
| Gaming Cage Workers | 34.6 |
| Gaming Service Workers | 31.3 |
| Food and Tobacco Machine Operators | 29.7 |
| Telephone Operators | 29.3 |
| Textile Machine Operators | 29 |
| Nurses | 28.9 |
| Home Care Aids | 28.7 |
| Entertainers | 28.4 |
| Bellhops and Concierges | 28.4 |
| Telemarketers | 28.1 |
| Waitstaff | 27.1 |
| Roofers | 26.8 |
| Maids | 26.3 |
| Corrections Workers | 21.3 |
| Law Enforcement | 14.47 |
| Doctors and Surgeons | 9.23 |
| Mechanical Engineers | 9.22 |
| Medical Scientists | 9.11 |
| Other Scientists | 8.79 |
| Legislators | 8. 74 74 |
| Audiologists | 7.77 |
| Dentists | 7.75 |
| Farmers | 7.63 |
| Podiatrists | 6.81 |
| Clergy | 5.61 |
| Optometrists | 4.01 |
| Agricultural Engineers | 1.78 |
*bonus: Law enforcement and police divorce rate is 14.47, while the rate for corrections workers is 21.3.
28. For instance, the groups with the most prolific experience of marriages ending in divorce are downscale adults (adults making less than $20,000
annually) (39 percent), Baby Boomers (38 percent), those aligned with a non-Christian faith (38 percent), African-Americans (36 percent), and people who consider themselves
to be liberal on social and political matters (37 percent).
29. Among the population segments with the lowest likelihood of having been divorced subsequent to marriage are Catholics (28 percent), evangelicals (26 percent),
upscale adults (adults making more than $75000 annually) (22 percent), Asians (20 percent) and those who deem themselves to be conservative on social and
political matters (28%).
30. Divorce Rate By Ethnicity ( for women ):
| Year | 25-29 yrs | 30-34 yrs | 35-39 yrs | 40-49 yrs | 50-59 yrs | 60-69 yrs | 70 + |
|---|---|---|---|---|---|---|---|
| White | |||||||
| 1996 | 19.7 | 26.1 | 32.2 | 40.8 | 36.1 | 26.6 | 17.2 |
| 2001 | 19.9 | 24.4 | 33.5 | 40.6 | 41.8 | 29.6 | 18 |
| 2004 | 12.4 | 23.2 | 30.5 | 39.1 | 44.3 | 33.9 | 18.1 |
| 2009 | 14.2 | 22.1 | 27.6 | 36.3 | 41.1 | 36.9 | 21.9 |
| Black | |||||||
| 1996 | 14.7 | 28 | 40.7 | 44.5 | 42 | 35.6 | 21.9 |
| 2001 | 20.6 | 24.5 | 37. 3 3 | 42.2 | 44.7 | 33.8 | 25.4 |
| 2004 | 11 | 20.1 | 37.1 | 39 | 47.8 | 37.2 | 26.7 |
| 2009 | 14.6 | 23.9 | 32.7 | 35 | 48.2 | 40.3 | 27.8 |
| Asian | |||||||
| 1996 | 9.3 | 12 | 14.3 | 22.8 | 23.2 | 4.9 | 8.5 |
| 2001 | 4.1 | 10.7 | 18.1 | 17.5 | 22.7 | 9.9 | 5 |
| 2004 | 1.9 | 6.1 | 11.4 | 20.1 | 19.9 | 9.6 | 9.1 |
| 2009 | 1.3 | 7.8 | 13.2 | 20.6 | 18.5 | 16 | 11.3 |
| Hispanic | |||||||
| 1996 | 15.5 | 17.4 | 24 | 33.2 | 31.7 | 25.6 | 20. 3 3 |
| 2001 | 12.5 | 15.5 | 26.5 | 28.5 | 34 | 26.5 | 21.5 |
| 2004 | 8.8 | 16.3 | 24.7 | 24.4 | 33.1 | 23.9 | 19.5 |
| 2009 | 10.5 | 16.3 | 18.1 | 23.7 | 30.2 | 25 | 24.2 |
Military Divorce
31. According to the Pentagon, the military divorce rate is 3.4 percent in the 2013 fiscal year. However, the rate was significantly higher in military women at 7.2 percent.
32. The Divorce rate among enlisted troops was 3.8 percent. Among officers, the divorce rate was 1.9 percent.
33. The Air Force has the highest divorce rate among enlisted troops of any military branch at 4.3 percent.
34. The divorce rate among U.S. Navy Seals is over 90 percent.
Divorce Rate in Specific Population Segments
35. The divorce rate among people 50 and older has doubled in the past 20 years, according to research by Bowling Green State University.
36. The divorce rate among couples where one spouse is in jail or prison for one year or more is 80 percent for men and close to 100 percent for women.
Same-Sex Divorce Statistics
37. About 1 percent of married same-sex couples get divorced each year, while about 2 percent of married straight couples divorce.
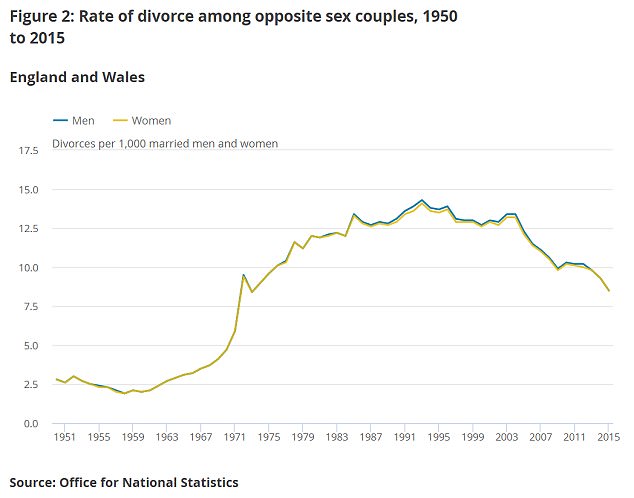
38. According to figures from the UK’s Office of National Statistics, lesbian couples are nearly twice as likely to end a marriage or civil union than gay male couples are.
39. In the United States, the divorce rate is 3.1 per 1000 people that allow same-sex marriage, and 3.9 in states that prohibit it.
When Do People Divorce?
40. The average length of a marriage that ends in divorce is 8 years.
41. January is considered “divorce month”. People start looking for information before the New Year starts, but they can’t do much until the attorneys are back in the office. January 12-16 seems to be the magic week for filings.
Why People are Divorcing in the United States
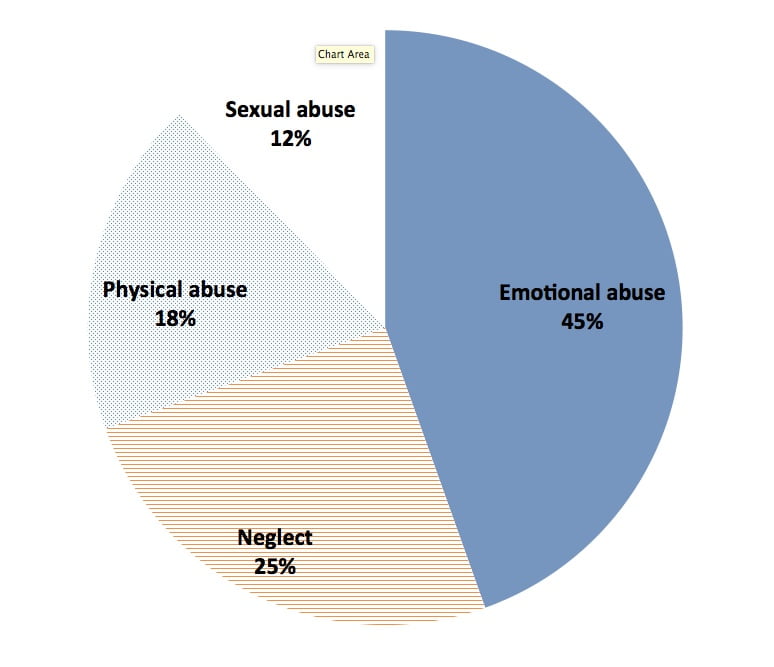
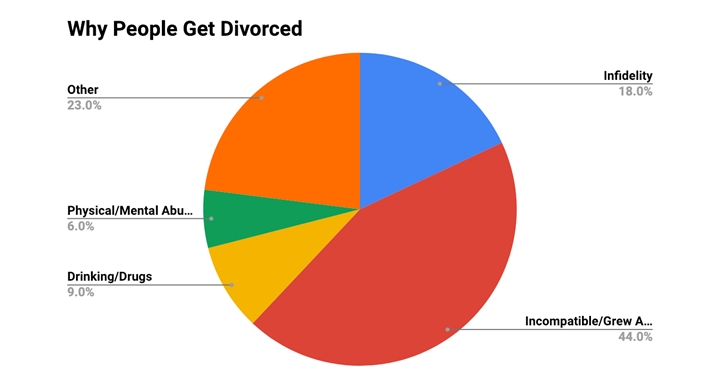
42. Lack of commitment is the most common reason given by divorcing couples according to a recent national survey. Here are the reasons given and their percentages:
- Lack of commitment 73%
- Argue too much 56%
- Infidelity 55%
- Married too young 46%
- Unrealistic expectations 45%
- Lack of equality in the relationship 44%
- Lack of preparation for marriage 41%
- Domestic Violence or Abuse 25%
(Respondents often cited more that one reason, therefore the percentages add up to much more than 100 percent)
What Makes People More or Less Likely to Divorce?
Your Age
43. 48 percent of those who marry before the age of 18 are likely to divorce within 10 years, compared to 25 percent of those who marry after the age of 25.
44. 60 percent of couples married between the age of 20 -25 will end in divorce.
45. Those who wait to marry until they are over 25 years old are 24 percent less likely to get divorced.
If you or your Partner Have Been Married Before
46. If both you and your partner have had previous marriages, you are 90 percent more likely to get divorced than if this had been the first marriage for both of you.
Religion and Divorce
47. If a person has strong religious beliefs, the risk of divorce is 14 percent less and having no religious affiliation makes you 14 percent more likely to get divorced.
48. If you’re an evangelical Christian adult who has been married, there’s a 26 percent likelihood that you’ve been divorced—compared to a 28 percent chance for Catholics and a 38 percent chance for non-Christians.
49. According to Dr. Jennifer Glass, one of the strongest factors predicting divorce rates (per 1000 married couples) is the concentration of conservative or evangelical Protestants in that county. The correlation can be seen on this figure: (insert divorce counties image)
Education and Intelligence
50. High School dropouts are 13 percent more likely to get divorced.
51. Individuals who have attended college have a 13 percent lower risk of divorce.
52. Those with “below average” IQs are 50 percent more likely to be divorced than those with “above average” IQs.
Political Affiliation
53. Political affiliation and it’s impact on divorce: Conservatives are the least likely to be divorced: Conservative 28 percent, Liberal 37 percent, Moderate 33 percent.
54. If you live in a red (Republican) state, you are 27 percent more likely to get divorced than if you live in a blue (Democrat) state.
Cohabitation – If you lived with your partner before you got married
55. 60 percent of cohabiting couples will eventually marry. However, living together prior to marriage can increase the chance of getting divorced by as much as 40 percent.
56. If you are a female serial cohabiter – a woman who has lived with more than one partner before your first marriage – then you’re 40 percent more likely to get divorced than women who have never done so.
Where You Met
57. According to this study at least, if you met your spouse in high school, college, or grad school, you are 41 percent less likely to get divorced.
58. The other major difference was couples who met in bars were 24 percent more likely to get divorced than expected.
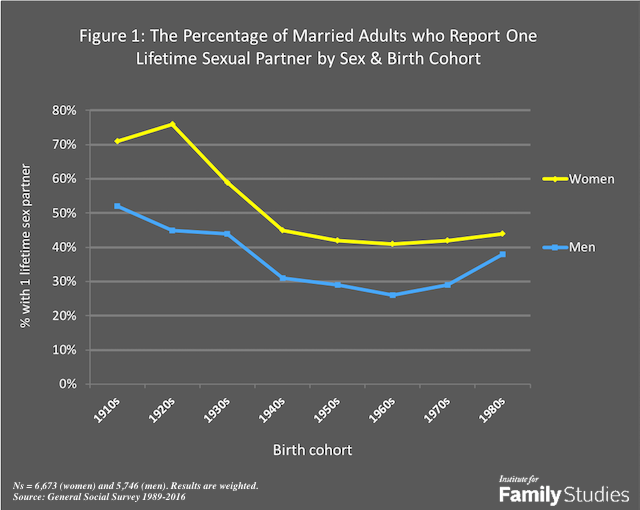
Your Sexual History
59. Women who lost their virginity as a teenager are more than twice as likely to get divorced in the first 5 years of marriage than women who waited until age 18 or older.
60. A 2011 study at the University of Iowa found that for both men and women, the loss of virginity before age 18 was correlated with a greater number of occurrences of divorce within the first 10 years of marriage.
61. When compared to women who began sexual activity in their early 20s, girls who initiated sexual activity at ages 13 or 14 were less than half as likely to be in stable marriages in their 30s. – (in this study a stable marriage was defined as a marriage of over five years).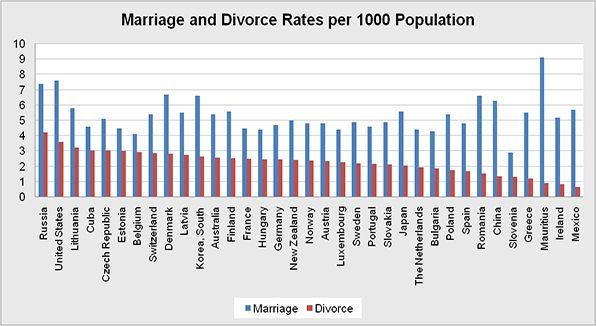
THE HARMFUL EFFECTS OF EARLY SEXUAL ACTIVITY AND MULTIPLE SEXUAL PARTNERS AMONG WOMEN
62. Women with 6 or more premarital sexual partners are almost 3 times less likely to be in a stable marriage.
Where You Live Impacts Your Likelihood to Be Divorced
63. According to the CDC, the five states with the highest divorce rates are:
- Nevada at 5.6
- West Virginia at 5.2
- Arkansas at 5.3
- Idaho at 4.9
- Oklahoma at 5.2
64. The five states with the lowest divorce rate are:
- Iowa at 2.4
- Illinois at 2.6
- Massachusetts at 2.7
- North Dakota at 2.7
- Pennsylvania at 2.8
65. Arkansas has the highest rate of individuals married 3 or more times. Men and women in Arkansas are twice as likely to be married 3 or more times than the national average.
Your Habits, Your Marriage
66. The risk of divorce was said to be almost doubled – 97 percent higher – when the mother went out to work but her husband made a “minimal contribution” to housework and childcare.
67. In 2011, Facebook was cited as a major contributor to 1/3 of divorce petitions examined by one U.K. study.
68. In a study by the University of Rochester, researchers said that watching romantic movies and having a conversation around it helps in lowering the divorce rates from 24 to 11 percent in marriages of three years.
69. Pornography addiction was cited as a factor in 56 percent of divorces according to a recent study.
Your Parent’s Relationship
70. If your parents are happily married, your risk of divorce decreases by 14 percent.
71. If your parents married others after divorcing, you’re 91 percent more likely to get divorced.
72. According to Nicholas Wolfinger in “Understanding the Divorce Cycle”, the risk of divorce is 50 percent higher when one spouse comes from a divorced home and 200 percent higher when both partners do.
73. In addition, children of divorce are 50 percent more likely to marry another child of divorce.
74. Certain studies have shown that daughters of divorced parents have a 60 percent higher divorce rate in marriages than children of non-divorced parents while sons have a 35 percent higher rate.
If you Have Kids or Not
75. The divorce rate for couples with children is as much as 40 percent lower than for those without children.
76. Half of all children in the United States will witness the ending of a parent’s marriage.
77. Of this half, close to 50 percent will also see the breakup of a parent’s second marriage.
78. If you have twins or triplets, your marriage is 17 percent more likely to end in divorce than if your children are not multiples.
79. If you have a daughter, you’re nearly 5 percent more likely to divorce than if you have a son.
80. When there are as many as three daughters that difference spiked to 10 percent.
81. Fathers are significantly less likely – 3 percent – to be living with their children if they have daughters versus sons.
82. Having a baby before marriage can increase the risk of divorce by 24 percent.
Your Finances and Their Effect on Divorce Rates
83. An annual income of over $50,000 can decrease the risk of divorce by as much as 30% versus those with an income of under $25k.
84. Feeling that one’s spouse spent money foolishly increased the likelihood of divorce 45 percent for both men and women.
85. Couples that argue about finances at least once a week are 30 more likely to get divorced.
86. The same study also found that couples with no assets at the beginning of a three-year period are 70 percent more likely to divorce by the end of that period than couples with $10,000 in assets.
Addiction, Mental Illness and Divorce
87. Couples are an astonishing 76-95% more likely to get divorced if only one of them smokes. The amount increases when the wife is the partner with the habit.
88. While couples who both smoke have it a bit better, a 1998 study found they are still 53% more likely than non-smoking couples to end their marriage.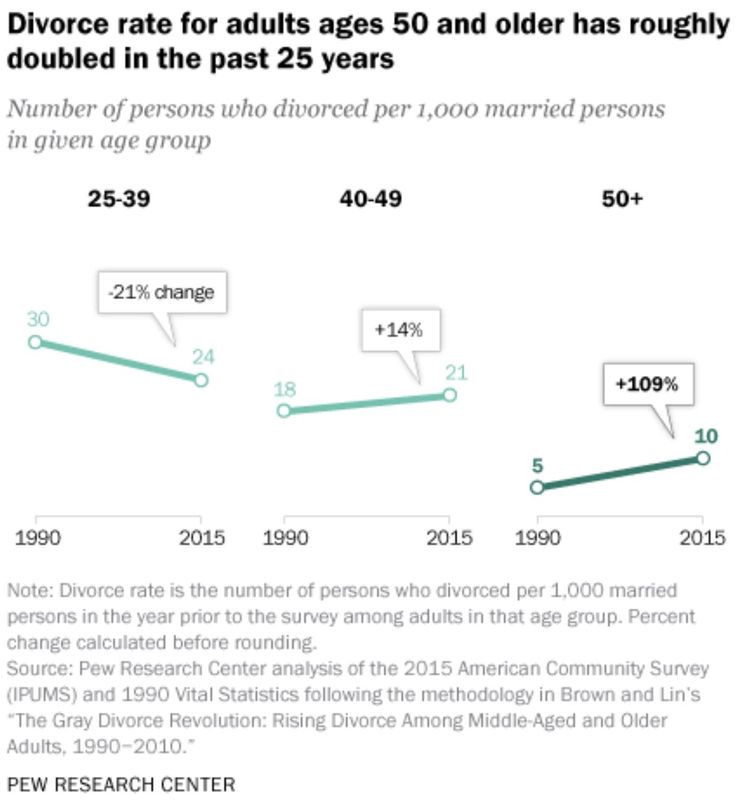
89. Each liter of alcohol consumed raises the chance of divorce by 20%! Factor in that the average American drinks 9.4 liters of alcohol per year, raising their divorce likely hood by 188%!
90. According to a 9-year study by the University of Buffalo, couples who have similar heavy drinking patterns – either both are heavy drinkers or both are not- are more likely to stay together.
91. However, if one spouse is a heavy drinker and the other is not, they are 60 percent more likely to get divorced.
92. A multi-national study of mental disorders, marriage and divorce published in 2011 found that a sample of 18 mental disorders all increased the likelihood of divorce — ranging from a 20 percent increase to an 80 percent increase in the divorce rate. Addictions and major depression were the highest factors, with PTSD (Post-Traumatic Stress Disorder) also significant.
93. A recent study of divorce petitions found that nearly 15 percent of them cited video game addiction as a major factor in the decision to get divorced.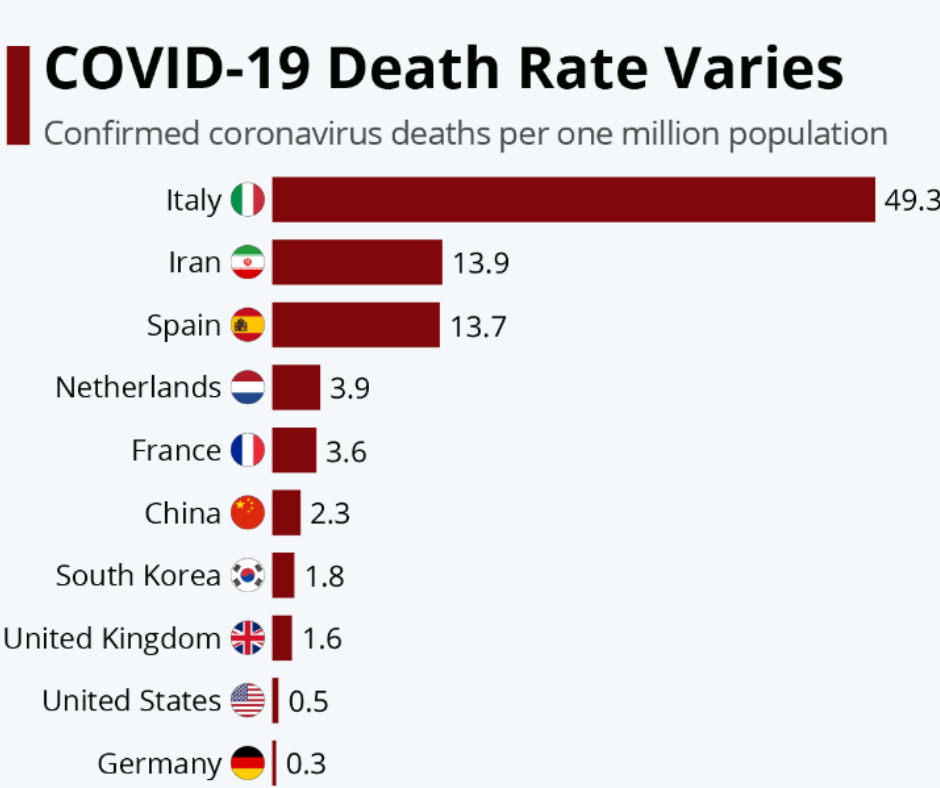
Divorce, Child Support and Child Custody
94. Forty-three percent of children in the United States are being raised without their fathers.
95. When the parents are happily married, the risk of divorce of their children decreases by 14 percent.
96. 90% of divorced mothers have custody of their children.
97. Over 79 percent of custodial mothers receive a child support award, while just under 30 percent of custodial fathers receive one.
98. 65% of divorced mothers receive no child support.
99. Over 46 percent of non-custodial mothers completely default on child support, compared to only 27 percent of non-custodial fathers.
Friend’s and Relative’s Impact on Divorce
100. If a close friend gets divorced, you are 147% more likely to become divorced and 33% more likely if a friend of a friend is divorced.
101. Studies at the University of California and Brown University cite that when a married person works with someone who is in the process of divorcing, it increases the married person chances of divorce by 75%.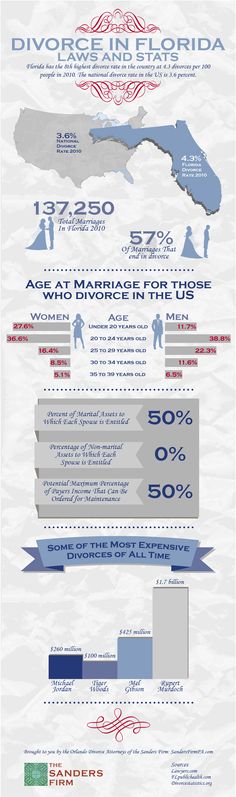
102. These same studies also found that people with divorced sisters or brothers are 22% more likely to get divorced than if siblings are not divorced.
103. In a large-scale Canadian survey, 19 percent of men reported a significant drop in social support post-divorce.
The Financial Effects of Divorce
104. The average total cost of divorce in the United States is $15,000.
105. Families with children that were not poor before the divorce see their income drop as much as 50 percent.
106. Almost 50 percent of the parents with children that are going through a divorce move into poverty after the divorce.
107. 27% of recently divorced women had less than $25,000 in annual household income compared with 17% of recently divorced men.
108. 60% of people under poverty guidelines are divorced women and children.
The Toll a Divorce Takes
109. A new study entitled “Divorce and Death” shows that broken marriages can kill at the same rate as smoking cigarettes. Indications that the risk of dying is a full 23 percent higher among divorcées than married people.
110. One researcher determined that a single divorce costs state and federal governments about $30,000, based on such things as the higher use of food stamps and public housing as well as increased bankruptcies and juvenile delinquency.
111. The nation’s 1.4 million divorces in 2002 are estimated to have cost the taxpayers more than $30 billion.
112. An article in the New York Times stated that – of couples who seek marriage counseling – 38 percent end up divorced just two years later.
113. Only around five percent of divorces are decided in the courtroom. This means in 95 percent of divorce cases, the parties and their family law attorneys are able to settle issues amicably or in mediation.
Bonus
The Five Most Expensive Divorces of all Time
According to an article on Divorce Help 360 here are the most expensive divorces of all time as well as the most expensive celebrity divorces of all time:
- Harold and Sue Ann Hamm – $5.
 3 billion
 - Rupert and Anna Murdoch – $1.7 billion
- Bernie and Slavica Ecclestone – $1.2 billion
- Adnan Khashoggi and Soraya Khashoggi – $875 million
- Craig and Wendy McCaw – $460 million
Most Expensive Celebrity Divorces
- Mel and Robyn Gibson – $425 million
- Arnold Schwarzenegger and Maria Shriver – $250-$300 million
- Michael and Juanita Jordan – $168 million
Contact our reputable San Diego family law attorneys for a consultation! Call today! 619-284-4113
35 Stunning Stats for 2022
The divorce rate in America provides insight into today’s relationships. Knowing what percentage of marriages end in divorce and when divorce is most likely to occur tells us where we fit in that picture.
While the US divorce rate has remained relatively stable over recent years, it has actually declined in the long term. As the following stats show, however, the divorce rate in the United States in 2022 doesn’t necessarily provide the whole picture of marital success, separations, and relationship breakdowns.
- The current divorce rate in the US is 2.3 persons per 1,000 people.
- Overall, the rate of divorces in America is falling.
- Divorces amongst people aged 50+ years are rising.
- Fewer couples choose to marry than pre-1990.
- The US divorce rate is the third-highest in the world.
- There were around 630,000 divorces in the US in 2020.
- Most Americans who file for divorce do so between January and March.
Divorce Rates in America Statistics 2022
1. The crude divorce rate in America is 2.3 per 1,000.
According to the CDC, the current divorce rate is just 2.3 per 1,000. However, only 45 states and the District of Columbia submitted enough data to be considered in this nationwide study. As Indiana, California, Hawaii, New Mexico, and Minnesota are not counted, there may be some variation in this figure.
2.
 Recent divorce rates suggest a decrease in the number of people dissolving their marriages.
 The divorce rate has increased since 1960. But since 1990, there has been a downward trend in divorce statistics. This suggests divorce rates over time are changing drastically, as are marriage and cohabitation trends. By assessing the divorce rate statistics by year, it’s easy to see that the rate of divorce in the US is on a general decline.
3. More people in the US were married in 2021 than in 1960.
Despite the overall long-term increase in divorce rates in America, more US residents were married in 2021 than in 1960. Still, this is most likely a side-effect of an increasing population on marriage and divorce statistics.
4. Around 630,000 divorces took place in the US in 2020.
In 2020, approximately 630,505 divorces were granted in America, meaning that around 1.27 million people divorced that year. The national divorce rates per year will likely continue to fall, as this trend has been going strong for several decades.
5. During the peak of the COVID-19 pandemic, the number of divorces fell by 12%.
The projected figure for 2020 was 714,997, and states like Maryland (43.3%) and Louisiana (56.5%) had the most significant declines in divorce filings.
6. Remarriage increases the risk of divorce.
According to the Census Bureau, you are more likely to get divorced if you’ve been married at least once before. In other words, people have to put extra effort into making a non-first marriage work.
7. There is a seasonal spike in divorces in the US.
More people file for a divorce between January and March than at any other time of year. Some researchers believe this is a side-effect of the perceived strain on familial relationships over the holidays.
8. On average, only 29 out of 1,000 divorced or widowed women decide to get married for the second time.
Around 58% of US-born adults decide to marry again after their first marriages end in divorce. The percentage of foreign-born US citizens going into a second marriage after their first divorce is slightly lower, at 51%.
9. Divorce rates vary dramatically from state to state.
The lowest divorce rate by state occurs in Massachusetts and Louisiana, with rates of just 1.0 and 1.4 per 1,000 people. Conversely, the states with the highest divorce rates are Wyoming and Alabama, with 3.8 and 3.7 divorcees per 1,000 people, respectively.
10. The average length of a marriage in the US is 19.9 years.
While the national average marriage length is just under 20 years, couples in Maine and West Virginia typically have the longest-lasting unions. The typical marriage in these lasts for 22.3 years.
11. The likelihood of divorce might be less than you think.
The most common question surrounding divorce in the United States is:
What percentage of marriages end in divorce?
Here’s the kicker:
Many people believe that this figure is around 50%. However, the actual percentage of marriages that end in divorce in the US varies between 40% and 50%. This means you are more likely to stay married than dissolve your marriage. Good news!
12. The divorce rate today is lower than a decade ago.
The divorce rate in America in 2019 and 2020 was significantly lower than in 2009 and 2010. Despite a slight increase in 2010-11, the overall divorce rate has fallen throughout the last decade.
13. The national divorce rate for adults aged 25-39 is 24 per 1,000 persons.
For adults aged between 40-49 years of age, it’s 21 per 1,000 persons. In contrast, the divorce rate amongst adults aged 50+ years is 10 in 1,000 persons. When comparing divorce rates by age group, it’s clear that the older population tends to stick around much longer before choosing to leave an unhappy marriage, although this age group’s divorce rates have been on the uptake for the 25 years between 1990 and 2015. On the other hand, the same rates among the younger population have been declining.
14. The rate of divorce after 10 years is 48% for those who marry before the age of 18.
However, the rate is just 25% for those who marry after the age of 25. For people who marry between the ages of 20-25, there is a 44%-60% chance of the union ending in divorce.
These statistics confirm that the couple's age at the time of marrying impacts subsequent divorce rates.
15. Baby boomer divorce rates have risen dramatically over the last 30 years.
So-called gray divorce rates, amongst adults aged 50+, the national divorce rate has roughly doubled since 1990. For those aged 65+, it has actually tripled, from 2 in 1,000 married persons to 6 in 1,000. This indicates people over 50 are more likely to get divorced now than ever before.
16. Successful marriage statistics are on the increase.
As divorce rates continue to reduce overall, successful marriage statistics increase accordingly. With a 40-50% chance of a marriage in the US ending in divorce, there is a 50%-60% chance that the marriage will not be dissolved. So, people who marry today stand a much better chance of having a successful marriage than ever before!
17.
 Ages 28-32 could be the best time to get married.
As we know by now, divorce rates vary by age. But there isn’t a linear trend that shows divorce rates increase or decrease as you get older. Still, people who marry in their late twenties or early thirties are statistically less likely to divorce.
18. People are 75% more likely to end their marriage if a friend is divorced.
According to a research team from Brown University, having divorced friends can significantly increase your chances of becoming divorced yourself. While you are 75% more likely to end your own marriage if you are friends with a divorcee, you are 33% more likely to get divorced if you have a friend of a friend who has formally ended a marriage.
19. Divorce rates are falling, but so are marriage rates.
Although divorce rates have fallen recently, marriage rates have also dropped. When comparing marriage vs. divorce statistics, it is vital to assess the rates in context.
In the 2000s, the national marriage rate in America was 8. 2 people per 1,000. Currently, it is 5.1 per 1,000. With more couples living together without formalizing their union, the divorce rate cannot accurately represent the number of long-term relationship breakdowns.
20. Separation doesn’t count in divorce statistics.
Most people who separate end up divorcing, but that’s not always the case.
91% of separated white women will divorce within three years, but this figure drops to 77% for Hispanic women and 67% for Black women. As long-term separation is not counted in most divorce statistics, the rate of marriage breakdowns could be higher than divorce rates suggest.
21. A higher education level for women means lower divorce rates.
The average marriage failure rate varies depending on each spouse’s level of education. 78% of women with bachelor’s degrees who married for the first time in 2006-2010 can expect their marriage to last for at least 20 years. In contrast, 49% of women with some college education and 40% of those with a high school diploma or less can expect their marriage to last for the same period.
Even though education-related divorce rate statistics imply that a higher level of education equates to a lower chance of divorce, this is moderated by the age of each spouse: The divorce rates for young couples are higher in part because people who get married before attaining higher education do so much earlier in their life than those who wait to finish college, and are therefore less likely to have the life experience necessary to make long-lasting matches.
23. The millennial divorce rate is lower than those of their predecessors.
People born between 1981 and 1996 are showing lower rates of divorce than older age groups. However, the millennial divorce rate may be impacted by the fact that this demographic typically chooses to marry at a later age, and many forego marriage in favor of cohabitation.
What’s more, millennials are less likely to have unrealistic expectations from marriage. As earlier generations typically married at a younger age and were less likely to cohabit before that, this contributes to their higher divorce rates.
24. Millennials are more cautious about marriage.
The generational gap in marriage and divorce rates may be partly due to the fact many millennials complete further education and begin their careers before tying the knot. While marriage and divorce rates in the US have fallen, the age at which millennials choose to marry is much higher compared to pre-1980 statistics.
25. Cohabiting can impact your risk of divorce.
Couples who do not cohabit before marriage are less likely to divorce within the first 20 years of their union. Men who live with their partner prior to marriage have a 49% chance of avoiding divorce for at least 20 years, while women who live with their partner before marriage have a 46% chance of remaining married for at least 20 years.
26. Divorce is less likely than cohabitee break-ups.
There is a 20% chance that the first marriage results in divorce within five years. In comparison, couples who cohabit for five years have a 49% chance of separating. Similarly, married couples have a 33% chance of divorce within 10 years, whilst cohabiting couples have a 62% chance of splitting up in this timeframe. These statistics indicate that married couples are likely to remain together longer than couples who choose to cohabit but do not marry.
27. Incompatibility is the leading cause of divorce in the US.
According to the Institute for Divorce Financial Analysts, the number one reason for divorce in America is “basic incompatibility.” 43% of research participants cited this reason as their primary decision to get a divorce. Infidelity and money issues were also highly relevant, with statistics showing that 28% and 22% of participants cited these reasons for obtaining a divorce.
These causes of divorce statistics highlight the most common reasons for couples to request a divorce, although parenting differences, addiction, and abuse are commonly cited, too.
28. 23.5% of marriages end in divorce due to domestic violence.
Divorced people cite a lack of commitment (75%) as the main reason their civil union ended in a divorce. Other influential factors are infidelity (59.6%), constant arguing and conflict (57.7%), and marrying too young.
Lack of preparation before marriage is an issue that 42.3% of interviewed participants and 77.8% of married/divorced couples mention as an issue.
Same-sex Marriage and Divorce in the US.
29. The gay marriage divorce rate is equal to that of different-sex couples.
The Williams Institute at the UCLA School of Law did publish data that suggested that the same-sex divorce rate was approximately half of the different-sex divorce rate. However, this was later retracted due to an error in calculating the rates. Revised figures showed the gay marriage divorce rate was broadly the same as married straight couples' divorce rate, in that around 2% of the population get divorced each year.
30. Same-sex divorce data is still limited in the US.
As same-sex marriages were only recognized on a federal level in the US in 2013, there is still a lack of data regarding the rate of same-sex divorces. Over the next 10-20 years, more data on married same-sex couples will be gathered, and divorce rates are likely to become clearer.
Divorce and Children in America
31. 52% of single parents have been married at some point.
Slightly more than half of all single parents have been married. Although this includes widows and widowers, it’s also indicative of many children being raised by divorced parents.
32. 35% of parents who are now cohabiting were once married to someone else.
This statistic implies that a significant number of children are being raised by or living with informal step-parents.
33. Children of divorced parents are more likely to get divorced themselves.
Divorce statistics for children of divorced parents suggest that daughters are 60% more likely to get a divorce themselves.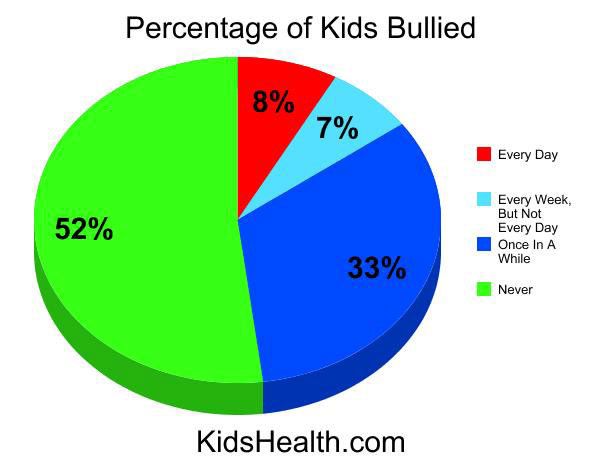 Sons are also more likely to get divorced, but “only” 35% more so than sons from non-dissolved marriages.
However, these stats do not account for the religious, moral, and socioeconomic factors that play a role in this pattern.
US Divorce Rates Compared to the Rest of the World
34. US divorce rates are higher than those of other continents.
Comparative analysis shows that divorce rates in America are higher than in Europe.
Some European countries have fairly similar divorce rates to those in the US, while others have a far lower national divorce average. For Europe as a whole, this average falls below the overall US divorce rate.
35. America has the third-highest divorce rate in the world.
According to the United Nations, the Maldives has the highest crude divorce rate, with 10.97 divorces taking place per 1,000 people each year. Belarus has the second highest worldwide divorce rate, with 4.63 per 1,000, followed by the US at 2.3 per 1,000 people.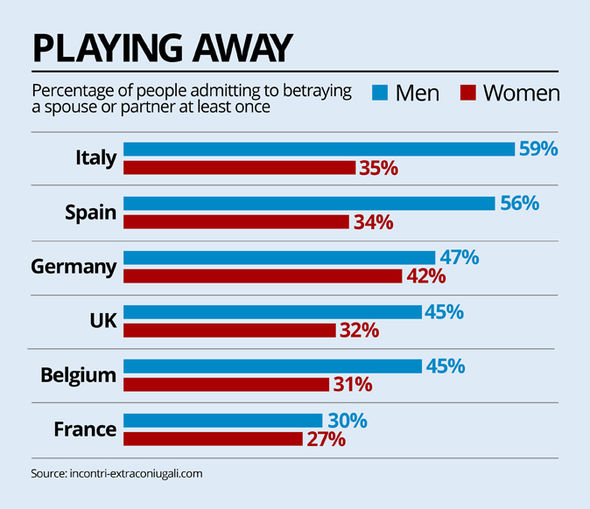
Conclusion
The divorce rate in America provides a snapshot of the changing institution of marriage and the views of average Americans.
Both the rate of divorce and the rate of marriage are falling. These statistics indicate that people are choosing more informal personal arrangements instead of formally recognized unions.
Whether you view the divorce rate in America by year or the divorce rate by years of marriage, the statistics regarding marriage dissolution represent society's changing views. Whereas marriage was once the norm, it is no longer seen as quite so essential for a fulfilled life.
Although many people expected the divorce rate 1950-present to increase, it has done the opposite. In the same way, today’s predictions regarding future figures may prove surprising.
Bitter for the young: why the number of divorces has increased in Russia | Articles
The number of divorces in Russia from January to May 2021 was a record for the last seven years.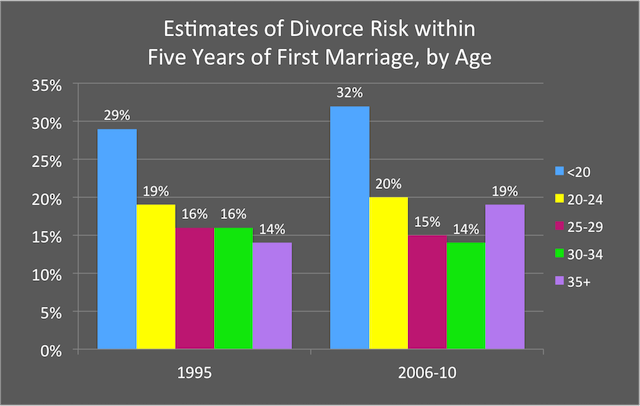 At the same time, against the background of the pandemic, the number of calls to sexologists and family psychologists has increased, experts said. The accumulated problems for some couples resulted in separation and mutual dislike. More details - in the material "Izvestia".
How many couples get divorced
The number of divorces in Russia from January to May 2021 increased by 44% compared to the same period last year, to 251.9thousand , calculated the international audit and consulting network FinExpertiza.
The most active divorces were in Ingushetia (3.5 times more often, 383 divorces), Chechnya (2.7 times, 900 divorces), Dagestan (2.1 times; 2.5 thousand divorces), Karachayevo- Circassia and North Ossetia (2 times, 750 and 1000 divorces, respectively). The leadership of the North Caucasian regions is explained by the fact that the number of divorces there traditionally remains at a minimum level, so even their slight increase leads to sharp changes in dynamics.
Bitter for the young
Photo: RIA Novosti / Evgeny Odinokov
Despite the fact that, in general, Russians entered into marriages more often (267.5 thousand) than dissolved them, in half of the regions divorces outnumbered marriages. This is most noticeable in the Leningrad region (by 31.2% more divorces than marriages), Kalmykia (by 22.9%), Saratov (by 20.3%), Penza (by 19%) and Ryazan regions (by 18 ,9%).
FinExpertiza experts explain the sharp increase in the number of divorces in the first half of 2021 by the fact that during the quarantine in 2020, Russians postponed divorce proceedings. Therefore, as soon as the registry offices returned to normal work, those who wanted to get a divorce began to catch up.
For the same reason, in 2021, the number of couples seeking to formally start a family increased by 30.1%.
Photo: FinExpertiza
Marriage and divorce statistics from January to March for the last 10 years
Residents of Kabardino-Balkaria (growth by 59. 8%, 1.4 thousand marriages), Oryol region (+58.8%; 1.2 thousand marriages), Mordovia (+56.2%; 881 marriages), Moscow Region (+51.1%; 17.2 thousand marriages) and Kalmykia (+49,eight%; 349 marriages).
It has become easier to get a divorce
Lawyer Viktoria Danilchenko also links the increase in indicators with the temporary closure of MFCs and registry offices. In order to get a divorce, people had to wait for the end of the quarantine measures.
- For some, this time was saving, but someone brought their decision to the final and still got divorced as soon as such an opportunity arose. The situation is the same with marriage: someone changed their mind, and someone waited, having the opportunity to additionally check the relationship, Danilchenko explained. - Divorce and marriage statistics can show a fall and rise in separate time periods. However, the average values will remain within the normal range.
Over the past couple of decades, according to the lawyer, those who want to officially register the relationship have become somewhat less.
Bitter for the young
Photo: Depositphotos/HayDmitriy
— This does not mean that there are fewer families, just that there are more couples choosing cohabitation without going to the registry office. There is also some increase in the number of divorces. This is due to the revision of family values, especially on the part of the younger generation. People have become easier to relate to the fact that it is better to break up with a person than to endure some kind of inconvenience in marriage, - said the interlocutor.
According to Danilchenko, both men and women are equally often initiators. Among the main reasons for the dissolution of marriage, Danilchenko names adultery, financial difficulties, addiction to alcohol and drugs.
Divorce is a difficult process not only from a moral, but also from a legal point of view. Many after the breakup of personal relationships are waiting for disputes about the place of residence of children, the division of property.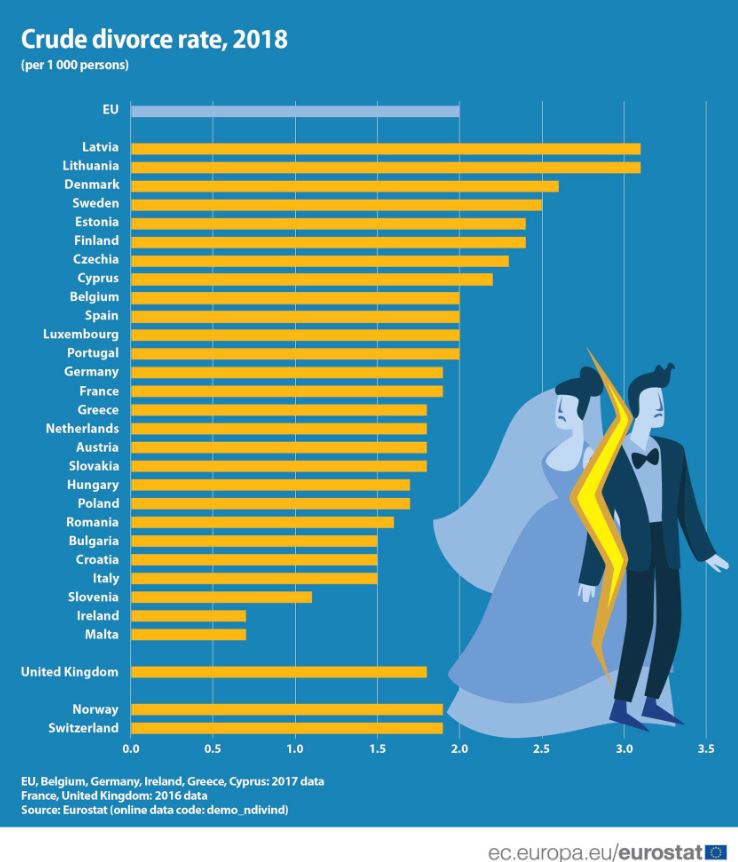 And if issues with children can be discussed only after the fact, amicably or through the courts, then the property issue is easily resolved in advance by concluding a marriage contract.
“Here the trend has become more positive in recent years,” the lawyer shared. “People are gradually ceasing to treat a prenuptial agreement as a sign of mistrust between spouses. There comes an understanding that this is a convenient tool that allows you to save a lot of money, time and nerves.
Ask a psychologist for help
Any cataclysms are always a test of a family's strength, family psychologist Natalya Panfilova believes. For some, the pandemic provided an opportunity to strengthen their marriage — couples realized that living in a family is better, more convenient and more reliable. For others, the lockdown has only exacerbated relations.
— When people feel bad together, but they go to work and don't see each other, such relationships can drag on indefinitely. But during the period of self-isolation, claims that were smoothed out due to diversity and the ability to switch, just splashed out, says Panfilova.
According to the psychologist's observation, the number of sharp and intense appeals has especially increased over the last year. Unusual processes began inside the family and previously hidden problems appeared.
Bitter for the young
Photo: Izvestiya/Konstantin Kokoshkin
— If people didn't know how to spend time together, it was hard for them to sit in isolation. Couples were saved by the fact that the wife with children, for example, went for a walk, and the husband at that time was engaged in repairs. That is, everyone does something useful for the family, but at the same time they do not intersect. Or the grandmother took the children to some circle, the husband and wife at this time can relax, make love.
Sexologist Irina Ayriyants agrees: forced isolation has become stressful for some couples. This was reflected in the number of receptions.
- Attendance usually peaked a month after the restrictions were announced. Last summer, after a hard lockdown in April and May, when it became possible to accept patients online and offline, their number increased. It was the same this year. If earlier we saw two or three patients a day, then at the peak their number could double, triple . When they got used to the situation with restrictions, the number of visits also leveled off,” said Ayriyants.
If we talk about sexological trends in general, in the past, according to the expert, requests for specific technical sexual problems prevailed. Now the practice is shifting to the area of family psychotherapy. The question arises of the impossibility of being together, of misunderstanding why to maintain a relationship.
Judging by medical practice, before the age of 30, the initiator of divorce is mainly a woman, and later, closer to 40–50 years, a man, the interlocutor emphasizes.
Bitter for the young
Photo: RIA Novosti / Evgeny Odinokov
- At the same time, older women are more likely to seek help not from a sexologist, but from a family psychotherapist. To my great regret, I rarely see them at receptions. The problem of female sexuality, premenopausal, menopausal periods in our country is not developed. Women after 50 do not disappear for society, as Zhvanetsky wrote. They stay, and they should also have a personal life.
Men, in turn, bring a woman to an appointment not with a desire to get a divorce, but with a desire to improve and diversify their intimate life.
— There are a lot of altruistic campaigns, to the honor of men, when a woman does not feel attraction and a partner wants to develop a good response in a woman together with a doctor. Of course, there are also selfish notes in this. But nevertheless, a man brings a soul mate not to quit, but to make her also interested, the expert concluded.
Number of divorces per 100 marriages (by regions of Russia)
Number of divorces per 100 marriages (by regions of Russia)
| 1 | Magadan Region | 86.49 |
| 2 | Leningrad region | 80.39 |
| 3 | Nenets Autonomous Okrug | 79.25 |
| 4 | Bryansk region | 75.81 |
| 5 | Komi Republic | 75 |
| 6 | Kalmykia | 74.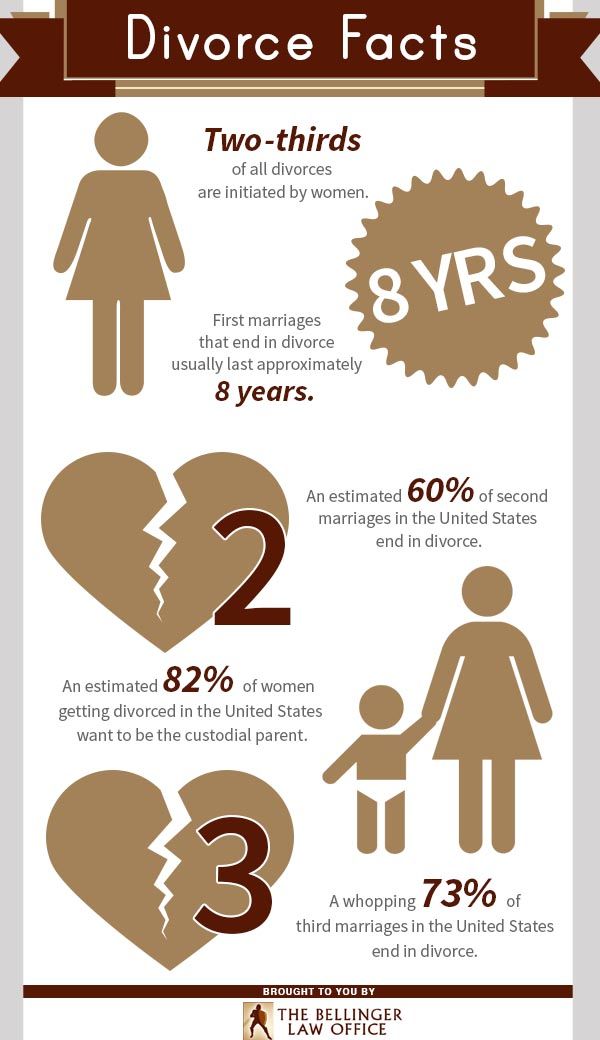 51 51 |
| 7 | Yamalo-Nenets Autonomous Okrug | 74.03 |
| 8 | Murmansk region | 73.33 |
| 9 | Chukotka Autonomous Okrug | 73.24 |
| 10 | Kurgan region | 73.02 |
| 11 | Smolensk region | 72.58 |
| 12 | Kemerovo region | 72.58 |
| 13 | Belgorod region | 72.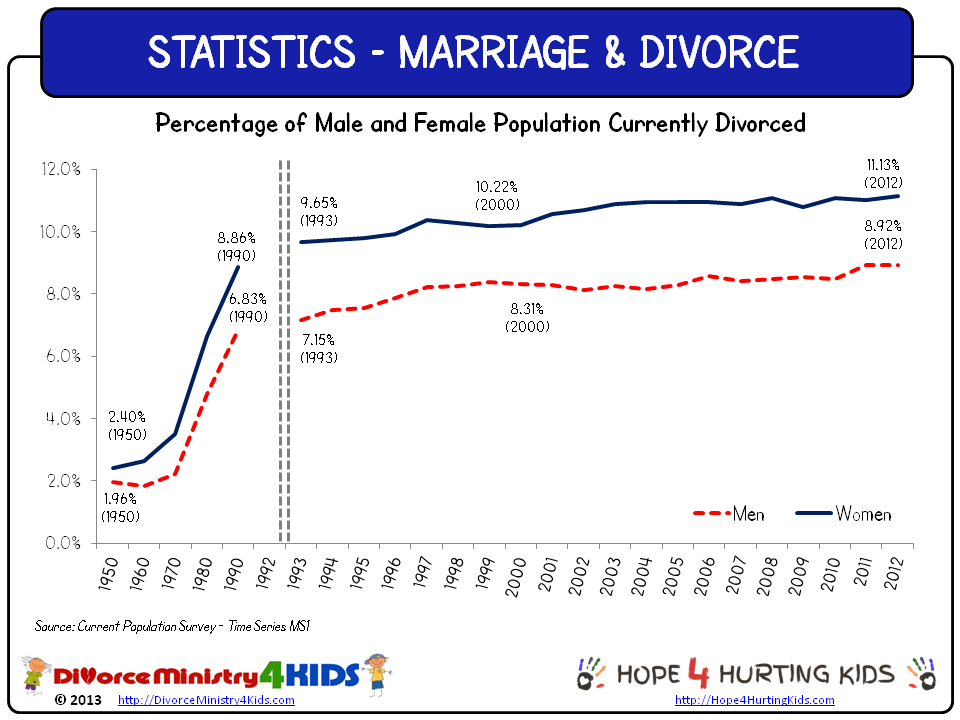 13 13 |
| 14 | Altai region | 72.13 |
| 15 | Kursk region | 72.13 |
| 16 | Kirov region | 71.93 |
| 17 | Khanty-Mansi Autonomous Okrug | 71.79 |
| 18 | Oryol Region | 71.67 |
| 19 | Kamchatka Krai | 70.93 |
| 20 | Amur region | 70.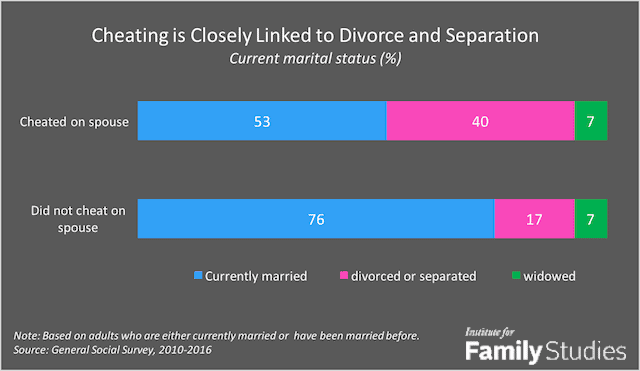 83 83 |
| 21 | Kaliningrad region | 69.74 |
| 22 | Khakassia | 69.7 |
| 23 | Sakhalin region | 68.67 |
| 24 | Chelyabinsk region | 68.66 |
| 25 | Mari El Republic | 68.52 |
| 26 | Penza region | 68.42 |
| 27 | Saratov region | 68. 33 33 |
| 28 | Volgograd region | 68.33 |
| 29 | Arhangelsk region | 68.25 |
| 30 | Pskov region | 68.25 |
| 31 | Rostov region | 68.25 |
| 32 | Adygea | 67.92 |
| 33 | Lipetsk region | 67.74 |
| 34 | Orenburg region | 67.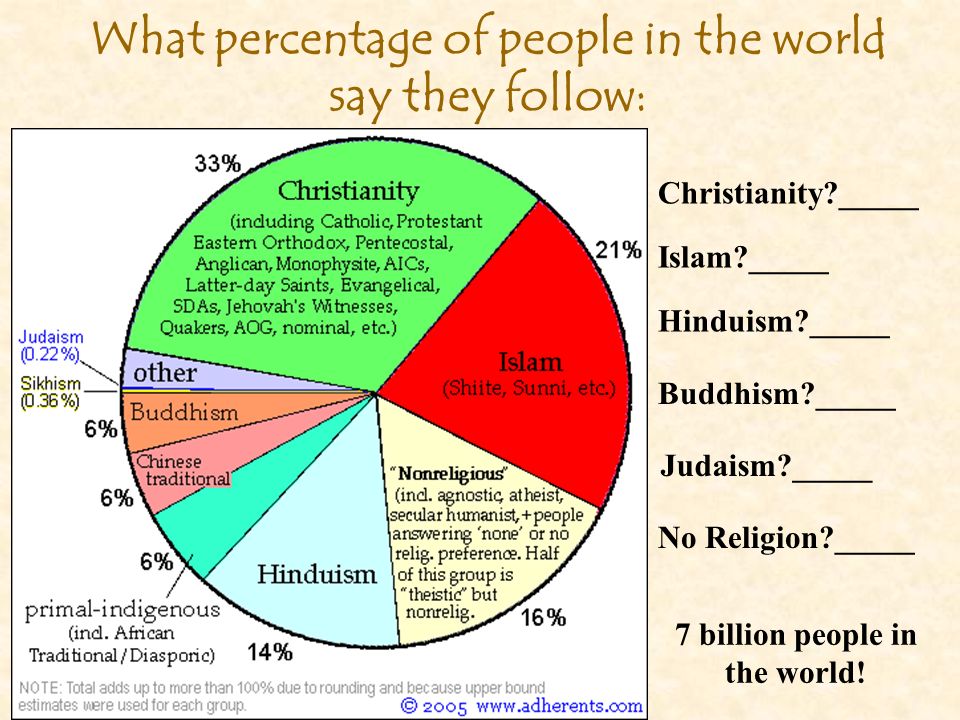 69 69 |
| 35 | Khabarovsk region | 67.53 |
| 36 | Tambov Region | 67.24 |
| 37 | Ryazan Oblast | 67.19 |
| 38 | Zabaykalsky Krai | 67.16 |
| 39 | Karelia | 67.16 |
| 40 | Stavropol region | 66.67 |
| 41 | Yakutia | 66. 15 15 |
| 42 | Voronezh region | 66.13 |
| 43 | Irkutsk region | 65.75 |
| 44 | Krasnoyarsk region | 65.75 |
| 45 | Samara Region | 65.67 |
| 46 | Kostroma region | 65.63 |
| 47 | Kaluga region | 65.22 |
| 48 | Altai Republic | 65. 15 15 |
| 49 | Tula region | 65.08 |
| 50 | Omsk region | 64.71 |
| 51 | Ivanovo region | 64.06 |
| 52 | Vologodskaya Oblast | 63.93 |
| 53 | Tyumen region | 63.89 |
| 54 | Krasnodar region | 63.89 |
| 55 | Astrakhan region | 63. 64 64 |
| 56 | Jewish Autonomous Region | 63.51 |
| 57 | Buryatia | 63.16 |
| 58 | Sverdlovsk region | 63.01 |
| 59 | Perm region | 62.69 |
| 60 | Tver region | 62.69 |
| 61 | Novosibirsk region | 62.67 |
| 62 | Vladimir region | 62.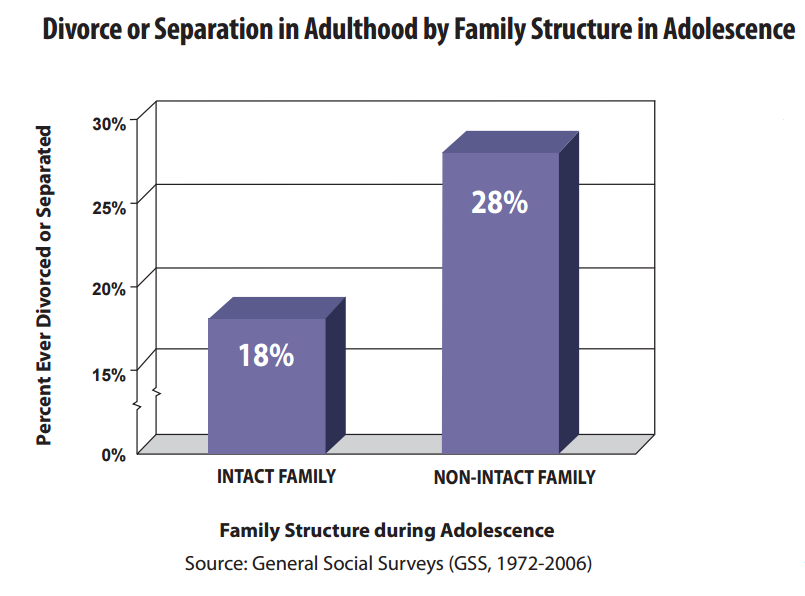 5 5 |
| 63 | Mordovia | 62.26 |
| 64 | Yaroslavl region | 62.12 |
| 65 | Tomsk region | 61.97 |
| 66 | Udmurtia | 61.4 |
| 67 | Moscow region | 61.33 |
| 68 | Bashkortostan | 61.29 |
| 69 | Chuvashia | 61.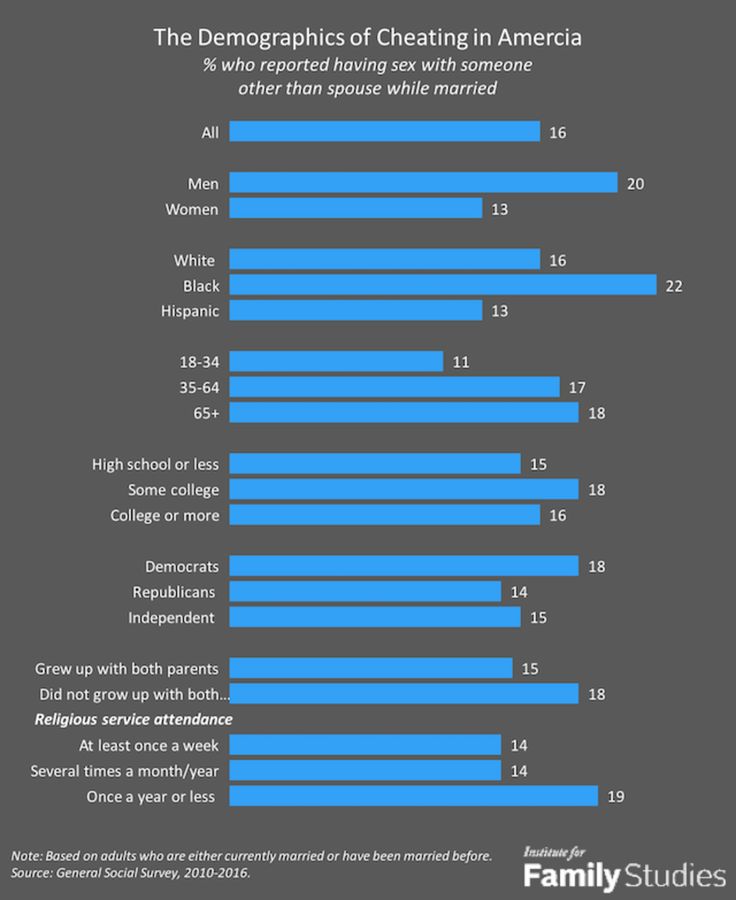 11 11 |
| 70 | Novgorod region | 60.81 |
| 71 | Primorsky Krai | 60.76 |
| 72 | Nizhny Novgorod Region | 60.61 |
| 73 | Karachay-Cherkessia | 59.62 |
| 74 | Ulyanovsk region | 59.09 |
| 75 | Tatarstan | 53.03 |
| 76 | North Ossetia | 50. 98 98 |
| 77 | Moscow | 50.72 |
| 78 | St. Petersburg | fifty |
| 79 | Kabardino-Balkaria | fifty |
| 80 | Sevastopol | 47.37 |
| 81 | Crimea | 46.48 |
| 82 | Tyva Republic | 29.09 |
| 83 | Dagestan | 27.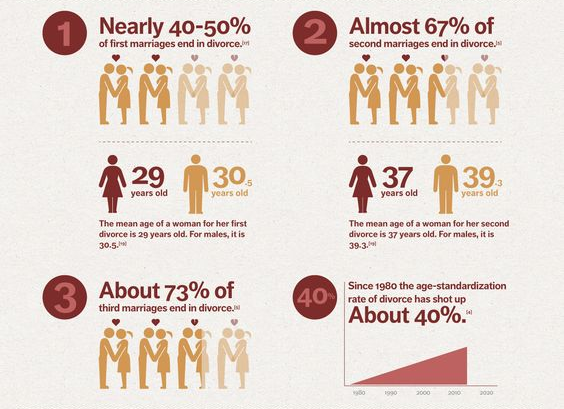    Copyright © · The Wright Initiative · Articles · Site Map 
|