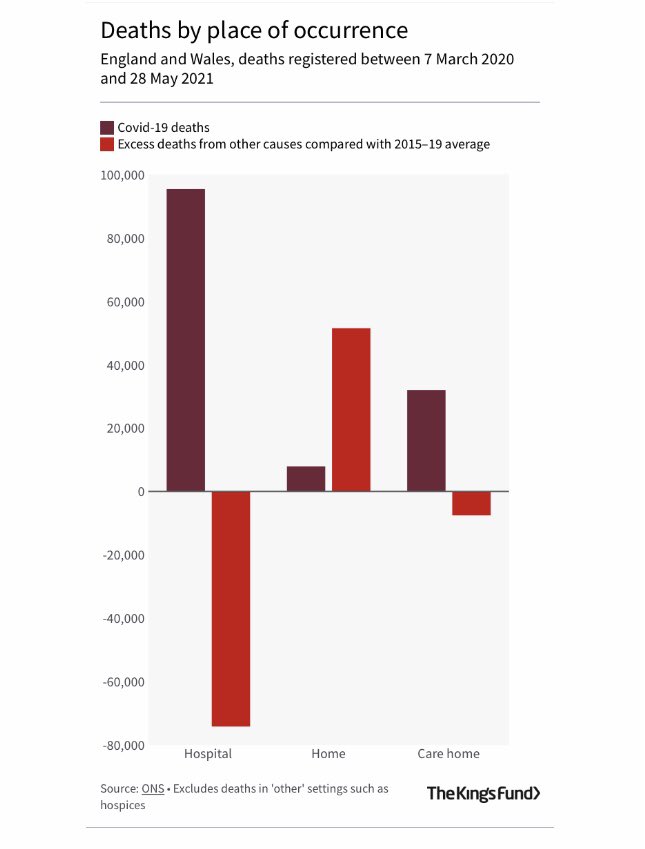
Percentage of occurrence aba
Taking Effective Data: Percentage and Rating Scales
Circling back to our look at the RBT™ Task List, let’s continue to look at A-02 Continuous Measurement procedures which is probably the most used method in school if you’re taking any direct observation data. These include ABC data collection, frequency or count, rate, latency, and a few more. Let’s look at PERCENTAGE and RATING SCALE recording. These are probably the most used in a school setting. Here we go!
Looking for student data tracking sheets to record daily incidents of challenging or problem behavior to help with classroom behavior management?
Contains a variety of forms for behavior data measurement systems in digital and print.
CLICK HERE to see them in my TpT store.
Read more about Behavior Management and the Crisis Cycle HERE.
Percentage Recording
Probably the most commonly used measurement in a school setting, in particular, but maybe even in a clinical setting.
A percentage measurement expresses a proportional quantity, correct-to-incorrect responses. For example, Joe follows routine one-step directions 80% of the time.
Percentage recording, while useful for measuring progress, has some considerations because if not done thoughtfully, it can be used incorrectly:
- Can be misleading. Think about it. If the goal is set for 80%, and the student was given 1 opportunity and got it right, that’s 100%, and if they got it wrong, that’s 0%. So the best way to use it is with the most opportunities possible to really see an accurate measurement.
- Has limited use because it has no time dimension. Doing 5 things in 5 minutes is quick different than doing 5 things in a month. Yet, the percentage would be the same if the numbers of correct was the same.
With that said, there’s an easy way to make percentage fairly practical: provide a minimum opportunity standard and a time frame.
For example, “will follow routine one-step directions 80% of the time of at least 5 consecutive opportunities within a 2-hour interval” or “will complete toileting routine independently in 8 out of 10 opportunities across three consecutive data days. ”
”
How do you take Percentage Recordings
- Have a clearly defined behavior. Can someone who doesn’t know the student identify the start and stop of the behavior if they read the description and see it in action?
- Make sure staff are trained and a good way to measure it (e.g., clipboard with behavior definition and data sheet).
- Mark whether the student’s response (the defined behavior) was Correct (+) or Incorrect (-) at the bare minimum. Additional insight may be useful with prompt levels required for correct responses.
- At the end of each identified set of opportunities, calculate the percentage by dividing the correct responses by the total number of opportunities. Express that in a percentage format.
Goal: When given a field of three pictures of common nouns and a direction to, “Find the…”, TimmyTuTu will point to the correct noun within 3 seconds improving receptive nouns from 25 nouns to 50 nouns (across 4 different classes) in 8 out of 10 opportunities (80%) on three consecutive data days.
Raw data (10 new words, materials in student’s binder): Day 1: + + – – – + + – – = 4 / 10 = 40%
Day 2: + + + – – – + – + – = 5 / 10 = 50%
And so on
Example of Percentage Recording
Previous
Next
Rating Scale Recording
Rating Scales are probably one of less objective and systematic ways to gather data, however, they have their place. I like to use this with staff who can’t attend to a student’s behavior at every moment, or for a behavior that’s a little “looser” in definition (more difficult to define a start and stop), or maybe just to gather some preliminary data before we develop a more robust data system.
Rating scales are almost always subjective, depending on the recall of the rater. I mean, unless you get VERY specific in the definition, it’ll be pretty hard to make the analysis objective.
However, I have found this system is good to supplement another recording measure. Like maybe I’m taking Whole Interval Recording during circle time but I also want a sort of temperature gauge on how the student did in general during the whole observation. Something like that.
How do you take Rating Scales
For a rating scale, a behavior is defined and then described in terms of a number scale. For example, maybe the behavior is “completing an assigned task,” and we decide the scale will be 1-5. We might define it like this:
1=Unable to proceed with assignment at all, completely stuck
2=Needs almost complete prompting, para sitting real close, many errors
3=Needs lots of prompting and directions, some answers independent, para sitting near by
4=Once the task is understood, begins and does most of task independently, no more than 20% incorrect
5=Able to read the directions and complete work independently, asking for help no more than one time, para not sitting at table
The rating is then given at the end of a pre-determined time (e. g., the first 5 assignments during the day).
You could then average those 5 ratings and get an overall rating for each day.
So if the ratings were 2, 3, 4, 4, 3 then the daily average would be 3.2.
It would also be smart to look deeper at the raw data to find trends. Are most of the 2’s occurring during Writing? Are the 4’s during a preferred activity or with a certain teacher?
Example of Rating Scales
What do you do with the information for Percentage or Rating Scales?
As always…
- Gather baseline data
- Implement a strategy and measure change
- Re-evaluate success of strategy and make a change if needed
- Go back to #2 and repeat until you hit your goal
- Gather reporting or final evaluation data
- Choose a new goal and keep going!
Find the examples from this blog post in this resource, plus TONS more!
These DIGITAL & Print special education data sheets and forms are perfect for assessing and collecting data on students and tracking communication. Content includes Google Forms, Google Slides, full-color printable PDF visuals, and Boom Cards. These are all forms that I have developed and used over time to help in my supervisory and teaching roles, mainly for students on IEPs and staff supporting them. Anything to make my life easier! And hopefully yours!
⭐ 100+ pages of forms and examples.
Get them in my store HERE or in my TpT store HERE.
Check out my TpT Store and Boom Store for more ideas!
Connect with me on Instagram
Frequency Versus Rate (BCBA Exam Prep) (ABA Terms)
In this brief blog article, we will examine the difference between frequency and rate. This article is useful for registered behavior technicians (RBT) or students who are studying to become board certified behavior analysts (BCBAs). Understanding (Applied Behavior Analysis) ABA terms is critical for both being an effective ABA therapist and passing your BCBA exam.
In an effort to help you study for your BCBA exam more effectively, this post is written in a “study note” form rather than as a long form blog post. Happy Studying!
Frequency definition-Frequency is a measure used in applied behavior analysis to count the number of times a behavior occurs. When using frequency, there is no specification as to the length of time a behavior was observed.
When to use a frequency measure-You should use frequency when you want to measure the number of times a behavior occurs and time does not matter. For example, if a child always has two hour long ABA sessions, you can use frequency. There is no need to calculate a rate when graphing a behavior because the session times are all the same.
An important note is that if a session is ever cut short due a family arriving late or a child getting sick and needing to end early, the data may look skewed and the graph will be inaccurate.
Another time that frequency is useful is if you are asking a parent to record how many times they observe a behavior. Typically, it is more challenging for a parent to try to determine a time based procedure and as a result they will be less likely to comply.
Examples of Frequency measures-Example 1: John got out of his seat 7 times during class.
Example 2: Jill had three toileting accidents.
Example 3: Jack said 70 words during his session today.
These are all examples of frequency because no time interval was specified.
Rate Definition-Rate is a measure used in ABA therapy that calculates the number of times a behavior occurs in a specific time inveral. A rate will always be expressed as an occurrence per hour. To determine the rate of behavior you divide the frequency by the time measure.
When to use a rate measure-You should use a rate when you want to record how many times a behavior occurs in a time interval (minutes, hour, days ect). It is very useful when comparing data between different ABA therapists when session times are unequal. It is a far more accurate measure than frequency.
Example 1: Kyle said thirty words per hour.
Example 2: Karen called out one time per hour during class today.
Example 3: Kaleb had three toilet accidents per day this week.
Difference between frequency and rate-In summary, both frequency and rate measure the number of times a behavior occurs. Rate is time based and frequency is not. Rate is more accurate and frequency is easier to calculate.
Features of vascular ultrasound using color Doppler and contrast enhancement
Authors: Johannes Rübenthaler, Maximilian Reiser, Dirk-André Clevert
Introduction
. one). Duplex ultrasonography is also the imaging modality of choice for monitoring patients after stent implantation or endarterectomy.
Quantification of stenosis of the internal carotid artery (ICA) is important for the clinical management of symptomatic patients with severe stenosis (70%-90%) of the ICA, as well as in asymptomatic patients with a high level of stenosis.
Figure 1: A, B. B-mode (A) and color Doppler (B) sonograms of the carotid artery showing the distal common carotid artery (asterisk), proximal internal carotid artery (ICA) (arrow), and external carotid artery (ECA) (arrowhead). C. Contrast-enhanced ultrasonography demonstrates the perfused lumen of the distal common carotid artery, proximal ICA, and ECA.
Abdominal ultrasound reveals abdominal aortic aneurysms (AAA) in 2-8% of men over the age of 65, with a 4-fold lower incidence in women. All AAAs are defined as an enlargement of the abdominal aorta greater than 3.0 cm or greater than 50% of normal size. Approximately 85% of all AAAs are found below the origin of the renal vessels. Surgery is recommended for any diameter greater than 5. 5 cm in men or 5.0 cm in women.
ABA gap shows mortality rate from 85% to 90%. Clinical management includes conservative treatment followed by ultrasound for asymptomatic AAAs less than 5.5 cm in diameter, as there is a higher risk of complications after intervention than rupture and surgical repair. Duplex ultrasonography is also the imaging modality of choice for detecting complications after femoral artery puncture, as they occur in 0.1%-9% of cases with aneurysms, with AV fistulas, dissections, and hematomas being the most common complications.
Contrast-enhanced ultrasound
Modern contrast modes use a low mechanical index mode that processes the non-linear signals emitted by contrast agent microbubbles and separates tissue and contrast agent signals. SonoVue (Bracco, Milan, Italy), the most commonly used modern ultrasound contrast agent, consists of phospholipid shells that stabilize microbubbles and their cores containing sulfur hexafluoride (SF6) gas. Phospholipids are metabolized endogenously and SF6 gas is excreted through the lungs over a period of up to 8 minutes.
Diseases of the carotid artery
Stenosis
About 10% -15% of all strokes and transient attacks of ischemic origin are the result of atherosclerotic stenosis of the ICA, especially in the proximal part. Most important in the initial treatment of ICA stenosis is the differentiation between complete ICA occlusion or pre-occlusive stenosis, which is characterized as at least 90% stenosis. Precclusive symptomatic stenosis can be treated with surgery or other interventional measures to prevent impending hemiparesis. With sensitivity from 86% to 98% and specificity from 87% to 100%, ultrasound of the vascular system of the ICA has a high diagnostic accuracy in characterizing ICA stenosis and differentiating ICA occlusion depending on the experience of the examiner and parameter settings. With CEUS, it is even possible to improve the visualization of carotid disease by detecting flow through stenosis even in elongated vessels, with no disadvantage depending on the angle or overlap of blood flow artifacts (Fig. 2).
2).
Figure 2: Ultrasonography of a 67-year-old woman with recent ischemic neurological symptoms.
B-mode shows high-grade internal carotid artery (ICA) stenosis with soft plaques (arrow). B, C. Duplex ultrasonography shows high-grade ICA stenosis (arrowhead) with a maximum systolic flow rate of about 500 cm/sec. D. Contrast-enhanced ultrasonography (CEUS) detects intrastenotic flow (arrowhead) and reveals total residual lumen and stenosis length. In addition, CEUS confirms the absence of neovascularization within the plexus (arrow).
Post-intervention follow-up
Carotid endarterectomy is the traditional treatment of choice for symptomatic and asymptomatic patients with ICA stenosis. Carotid artery stenting (CAS) is an alternative to carotid endarterectomy, especially in patients at high risk of complications after surgery, such as patients with significant cardiopulmonary disease. The use of CEA carries a risk of restenosis of about 25%, while the risk of restenosis after SAS is below 5% in most cases in the first 5 years after stenting. Duplex ultrasonography and CEUS are the imaging modalities of choice for post-intervention follow-up of restenosis after CCA and for characterization of in-stent restenosis after stenting (Figure 3)
Figure 3: Ultrasound after placement of an internal carotid artery (ICA) stent.
B-mode shows stent (arrows). B. Doppler ultrasound cannot show any stenosis in the stent. C. Cross-sectional contrast-enhanced ultrasound (CEUS) image of the stent shows a semicircular soft plaque (arrow) and the remaining perfused lumen of the stent. According to the criteria for area stenosis, the degree of stenosis in the stent will be approximately 40-50%. D. CEUS showing some soft plaques (arrow) on the anterior wall of the stent.
Complications after intervention
With an incidence of about 2%-10%, carotid artery puncture is the most common complication after catheterization of the internal jugular vein. This intervention is mainly performed in the intensive care unit or for interventional radiological procedures. The most important complication is an arteriovenous fistula, which can sometimes be seen clinically as swelling of the neck, sometimes pulsatile. (Fig. 4)
Figure 4: A. B-mode cross section identifies a hypoechoic structure suggesting a hematoma (arrows) with no connection between the common carotid artery (asterisk) and the internal jugular vein (arrow). B. Hematoma shows no perfusion (arrows) on color doppler. C, D. Contrast-enhanced sonograms of the common carotid artery demonstrate contrast absorption within the hematoma (arrowheads) as the presence of a pseudoaneurysm.
Characterization of plaques
Ulcerative plaques are believed to be a factor in the etiology of strokes in carotid artery disease. The use of CEUS is an imaging technique for identifying ulcerative plaques, which may be caused by inflammation and neovascularization within the plaque (Fig. 5)
Figure 5: Ultrasound of an atheromatous plaque in the carotid artery.
B-mode shows significant stenosis of atheromatous plaques (arrows). B. Contrast-enhanced ultrasonography shows intra-plaque neovascularization (arrowhead) as a sign of plaque vulnerability.
DO YOU CARE THE ULTRASONIC MACHINE CORRECTLY?
Download the care guide now
Abdominal aortic aneurysm
Abdominal aortic aneurysm
AAA is defined as an enlargement of the abdominal aorta greater than 3.0 cm or greater than 50% of normal size. The ABA gap shows a mortality rate of 85% to 90% and is the 10th most common cause of death in men over 55 years of age. Immediate treatment of a ruptured AAA is essential, as an untreated ruptured AAA is more likely to result in death. Approximately 85% of all ABA found below the exit of the renal vessels.
Surgery is recommended for any diameter greater than 5.5 cm in men or 5.0 cm in women. The main risk is rupture, with a risk of less than 1% for aneurysms less than 5. 5 cm in diameter, 10% for aneurysms 5.5 to 7.0 cm in diameter, and 33% for aneurysms greater than 7.0 cm in diameter. With a sensitivity of 95%-98%, duplex ultrasonography is the initial imaging modality for diagnosing AAA. The use of CEUS can help visualize direct signs of rupture (Fig. 6).
Figure 6: Ultrasound of an aortic aneurysm. Sonograms A, B. B-mode (A) and color Doppler (B) demonstrate an infra-aortic aneurysm (arrows). C. Real-time resolution quadruple contrast ultrasonography shows the same infrarenal aortic aneurysm in the x-plane (upper right), y-plane (mid-right), and z-plane (lower right) with 3D image (left).
Complications after transfemoral puncture
Pseudoaneurysms
False aneurysms or pseudoaneurysms after transfemoral puncture occur in 0.05% -9% of all cases. They are characterized as a tear in the layer of the arterial wall that does not close after puncture. Leaking blood causes a pulsating hematoma that forms a blood-filled cavity that is supplied through the junction between the cavity and the punctured artery. As size increases, the risk of rupture increases, necessitating rapid diagnosis (Fig. 7)
Figure 7: Ultrasound of the femoral artery after catheter intervention.
A, B. B-mode (A) and color Doppler (B) femoral artery cross-sections (asterisks) identify pseudoaneurysm (arrowheads) without any discernible flow signal. C. Contrast-enhanced ultrasonography shows partial perfusion (arrow) of the pseudoaneurysm, while the distal portion is not perfused (arrows).
Arteriovenous fistula
Arteriovenous fistulas occur in 0.1% -3.6% of all cases after transfemoral puncture. They are described as iatrogenically abnormally associated arteries and veins. If the fistula is large enough, they may be hemodynamically significant, causing a decrease in peripheral resistance.
Arteriovenous fistulas tend to increase in size, making surgery the preferred intervention in many cases. In some cases, an arteriovenous fistula occurs spontaneously or can be compressed by ultrasound. (Fig. 8)
Figure 8: Ultrasound of the femoral artery after catheter intervention.
A, B. In B-mode (A) and color Doppler (B) transverse sections, an AV fistula with turbulent flow in an AV fistula (arrowheads) is shown between the common femoral artery (arrow) and vein (asterisk)). The full extent of a fictional track is due to the delimitation of aliases. C. Contrast-enhanced ultrasonography of the common femoral artery and vein revealed the full extent of the arteriovenous fistula tract (arrowheads) and confirmed the presence of an arteriovenous communication. The distal portion of the common femoral vein (asterisk) shows no contrast absorption due to arterial scanning.
Dissection
Dissection occurs in 0.3% -3.6% of all cases after transfemoral puncture. Similar to that previously described for carotid transection, vascular ultrasonography is the imaging modality of choice for detecting and characterizing dissection, showing fresco hematoma as well as false and true lumen, and additionally visualizing any reduction in false lumen volume flow that results in to an increased risk of thrombosis, embolization, or even partial or complete occlusion of the artery. As discussed earlier, modern ultrasonic probes can identify small incisions with very thin membranes less than 1 mm. CEUS can improve diagnostic accuracy in complex cases (Fig. 9, ten).
Hematoma
Hematoma occurs in 0.4% -11% of all cases after transfemoral puncture and is a fairly common complication in this case. Hematomas are usually locally limited and resorb within a short period of time. They can be easily imaged with duplex ultrasound.
Figure 9: Ultrasound of the dissection of the common femoral artery.
Sonograms A, B. B-mode (A) and color Doppler (B) show the common femoral artery with intimal dissection (arrows). Both lumens are perfused in color Doppler mode (arrows). C. Due to their excellent spatial resolution, the transecting membrane (arrowheads) and both perfused lumen are clearly imaged on contrast-enhanced ultrasound.
Figure 10: Ultrasound of the common femoral artery with a suspicious dissection.
Sonograms A, B. B-mode (A) and color Doppler (B) show incomplete perfusion of the vessel lumen (arrows). C, D. Longitudinal (C) and transverse (D) contrast images show a floating embolus (arrowheads) in the center of the common femoral artery (arrow).
Conclusion
For the detection, characterization and observation of vascular pathologies, duplex ultrasonography is the first choice. However, duplex ultrasound has technical limitations in diagnostic use, for example due to superimposed artifacts that can complicate diagnosis. The use of CEUS may improve diagnostic efficiency.
Carotid and peripheral vascular CEUS examinations improve discrimination of vascular disorders in selected cases. It is a fast, non-ionizing, cost-effective visual modality with virtually no contraindications. The use of an ultrasound contrast agent increases the sensitivity of ultrasound in vascular disease and overcomes some of the limitations in detecting blood flow in vascular structures.
In our catalog you can find devices with support for examinations with contrast agents. If you have any questions, please contact our manager and he will answer them.
Autism spectrum disorders in children
home
Articles
Diseases
Alpatsky Dmitry Aleksandrovich Neurologist, epileptologist, EEG doctor
07.12.2015
Often, mothers come to the doctor with complaints of delayed speech development in a child. But in some children, with a close look, the specialist, in addition, sees the features of the child's behavior that differ from the norm and are alarming .
Consider a clinical example:
Boy S. Age 2 years 9 months. According to the mother, the child's vocabulary is no more than 20 separate words, consisting of two or three syllables. There are no phrases. Mom says that the child often has tantrums, is restless, it is difficult to fall asleep. The child's mother has no other complaints. On examination, the doctor notices that the child does not look into the eyes, is constantly in motion, reacts with a cry if something is not given or forbidden to him. You can calm the child only by giving him a mobile phone or tablet. Shows interest not in children's toys, but more in shiny pieces of furniture and interior. Starting to play something, quickly loses interest and switches to something else. Asking the mother, it turns out that the child is very selective in food. Not accustomed to the potty, defecation only in a diaper in a standing position. Difficulty falling asleep and waking up during sleep. The child underwent Electroencephalography and consultations with a clinical psychologist and a speech therapist. Based on the results of the diagnosis and the clinical picture, the diagnosis was made - Autism Spectrum Disorder.
Autism Spectrum Disorders (ASD) are complex disorders of mental development that are characterized by social maladaptation and inability to social interaction, communication and behavioral stereotypy (multiple repetitions of monotonous actions).
Back in the middle of the last century, autism was a fairly rare disease. But over time, more and more children suffering from this disorder began to appear. Statistics show that the incidence of ASD in children over the past 30-40 years in countries where such statistics are carried out has risen from 4-5 people per 10,000 children to 50-116 cases per 10,000 children. At the same time, boys are more susceptible to this disease than girls (approximately 4:1 ratio).
Causes of RAS.
All over the world, until today, scientists studying the causes of autism have not come to a consensus. Many assumptions are put forward. Among the possible factors for the appearance of this disorder in children are some hypotheses:
- genetic predisposition hypothesis
- a hypothesis based on disorders of the development of the nervous system (autism is considered as a disease caused by disorders of brain development in the early stages of a child's growth).
- hypotheses about the influence of external factors: infections, chemical effects on the mother's body during pregnancy, birth trauma, congenital metabolic disorders, the influence of certain drugs, industrial toxins.
But whether these factors really can lead to the appearance of autism in children has not yet been clarified.
Features of the mental development of children with ASD.
To understand and recognize the presence of autism in a child, parents need to carefully monitor the behavior of the child, notice unusual signs that are not characteristic of the age norm. Most often, these signs can be detected in children under the age of 3 years.
Childhood autism is considered as a developmental disorder that affects all areas of the child's psyche: intellectual, emotional, sensitivity, motor sphere, attention, thinking, memory, speech.
Disorders of speech development : absent or weak cooing and babbling may be noted at an early age. After a year, it becomes noticeable that the child does not use speech to communicate with adults, does not respond to a name, and does not follow verbal instructions. By the age of 2, children have a very small vocabulary. By the age of 3 they do not build phrases or sentences. At the same time, children often stereotypically repeat words (often incomprehensible to others) in the form of an echo. Some children have a lack of speech development. For others, speech continues to develop, but there are still communication impairments. Children do not use pronouns, address, speak about themselves in the third person. In some cases, there is a regression of previously acquired speech skills.
Difficulties in communication and lack of emotional contact with others: Such children shun tactile contact, there is almost no eye contact, there are inadequate facial reactions and difficulties in using gestures. Children most often do not smile, do not reach out to their parents and resist attempts by adults to take them in their arms. Children with autism lack the ability to express their emotions, as well as to recognize them in the people around them. There is a lack of empathy for other people. The child, along with the adult, does not focus on one activity. Children with autism do not make contact with other children or avoid it, they find it difficult to cooperate with other children, most often they tend to retire (difficulties in adapting to the environment).
H violation of exploratory behavior: children are not attracted by the novelty of the situation, they are not interested in the environment, they are not interested in toys. Therefore, children with autism most often use toys in an unusual way, for example, a child may not roll the whole car, but turn one of its wheels monotonously for hours. Or not understanding the purpose of the toy to use it for other purposes.
Eating disorders : a child with autism can be extremely selective in the offered products, food can cause the child to be disgusted, dangerous, often children begin to sniff food. But along with this, children may try to eat an inedible thing.
Violation of self-preservation behavior: due to a large number of fears, the child often finds himself in a situation that is dangerous for himself. The cause can be any external stimulus that causes an inadequate reaction in the child. For example, a sudden noise may cause a child to run in a random direction. Also, the reason is ignoring real threats to life: a child can climb very high, play with sharp objects, cross the road without looking.
Impaired motor development: as soon as the child begins to walk, he is noted for clumsiness. Also, some children with autism are inherent in walking on their toes, a very noticeable violation of the coordination of hands and feet. It is very difficult for such children to teach everyday actions, it is rather difficult for them to imitate. Instead, they develop stereotypical movements (performing the same actions for a long time, running in circles, swinging, flapping “like wings” and circular movements with their arms), as well as stereotypical manipulations with objects (tweaking small details, lining them up). Children with autism have significant difficulty in learning self-care skills. Pronounced motor awkwardness.
Perception disorders: difficulties in orientation in space, fragmentation in the perception of the environment, distortion of a holistic picture of the objective world.
Difficulties in concentration: children have difficulty focusing on one thing, there is high impulsivity and restlessness.
Poor memory: both parents and professionals often notice that children with autism are good at remembering things that are meaningful to them (this may cause them pleasure or fear). Such children remember their fear for a long time, even if it happened a very long time ago.
Features of thinking: experts note difficulties in arbitrary learning. Also, children with autism do not focus on understanding the cause-and-effect relationships in what is happening, there are difficulties in transferring the acquired skills to a new situation, the concreteness of thinking. It is difficult for a child to understand the sequence of events and the logic of another person.
Behavioral problems: negativism (refusal to listen to instructions from an adult, to perform joint activities with him, avoiding a learning situation). Often accompanied by resistance, screams, aggressive outbursts. A huge problem is the fears of such children. Usually they are incomprehensible to others, because often children cannot explain them. The child may be frightened by sharp sounds, some specific actions. Another behavioral disorder is aggression. Any disorder, violation of a stereotype, interference of the outside world in a child's life can provoke aggressive (hysteria or physical attack) and auto-aggressive outbursts (damage to oneself).
Each case of the disease is very individual: autism can have most of the listed signs in an extreme degree of manifestation, and it can manifest itself only in some barely noticeable features.
Diagnosis of autism spectrum disorders
To diagnose autism, specialists use the criteria of 2 international classifications: ICD-10 and DSM-5.
But the main three criteria (“triad” of violations) that can be distinguished are:
- violation of social adaptation
- violations in the communication sphere
- stereotypical behavior
The main diagnostic steps include:
- examination of the child by a psychiatrist, neurologist, psychologist
- observation of the child and filling out the "Autism Rating Scale", which can be used to determine the severity of the disorder
- conversation with parents
- filling in questionnaires by parents - "Questionnaire for the diagnosis of autism"
PAC species
There are several existing classifications of ASD, and the separation often occurs on completely different grounds, which, of course, can bring some inconvenience to a person who is initially little familiar with medicine or psychology; therefore, the most basic and frequently encountered types of ASD will be highlighted below: - Kanner's syndrome (Early childhood autism) - characterized by a "triad" of the main violations: difficulty in establishing contacts with the outside world, stereotypical behavior, as well as a delay or violation of the communicative functions of speech development . It is also necessary to note the condition of the early onset of these symptoms (up to about 2.5 years)
It manifests itself in children in 4 forms, depending on the degree of fencing off from the outside world:
Complete detachment from what is happening. This group is characterized by the absence of speech and the inability to organize the child (to establish eye contact, to achieve the implementation of instructions and assignments). When trying to interact with the child, he shows the greatest discomfort and impaired activity.
Active rejection. It is characterized by more active contact with the environment than the first group. There is no such detachment, but there is rejection of a part of the world that is unacceptable to the child. The child shows selective behavior (in communication with people, in food, in clothes)
Preoccupation with autistic interests. It is characterized by the formation of overvalued addictions (for years a child can talk on the same topic, draw the same plot). The gaze of such children is directed at the face of a person, but they look "through" this person. Such children enjoy the stereotyped reproduction of individual impressions.
Extreme difficulty in organizing communication and interaction. Autism at its mildest. Children are characterized by increased vulnerability, contact with the world stops at the slightest sensation of obstacles. These children can make eye contact.
- Asperger's Syndrome. Formed from birth. Children have an early onset of speech development, a rich vocabulary, developed logical thinking, and there are no disorders in mental development. But at the same time, the communicative side of speech suffers: such children do not know how to establish contact with other people, do not listen to them, can talk to themselves, do not keep a distance in communication, and do not know how to empathize with other people.
- Rett syndrome. Its peculiarity lies in the fact that the development of a child up to 1-1. 5 years proceeds normally, but then the newly acquired speech, motor and subject-role skills begin to disintegrate. Characteristic for this condition are stereotypical, monotonous movements of the hands, rubbing, wringing, while not carrying a purposeful character. The rarest of the presented diseases, occurring almost always only in girls.
- Childhood psychosis. The first manifestation of symptoms before 3 years of age. It is characterized by violations of social behavior, communication disorders. There are stereotypes in behavior (children run in a monotonous circle, sway while standing and sitting, fingering their fingers, shaking their hands). These children have eating disorders: they can swallow food without chewing. Their unclear speech can sometimes be an incoherent set of words. There are times when children freeze in place, like dolls.
- Atypical autism. It differs from autism in terms of age manifestation and the absence of one criterion from the “triad” of major disorders.
Correction of patients with ASD
One of the most important sections of habilitation for children with ASD is undoubtedly the provision of psycho-correctional and social rehabilitation assistance, with the formation of social interaction and adaptation skills. Comprehensive psycho-correctional work, which includes all sections and types of rehabilitation assistance, which will be described below, is, along with drug therapy, an effective means of stopping the negative symptoms of ASD, and also contributes to the normal inclusion of the child in society. Types of RAS correction:
1) Psychological correction - the most common and well-known type; It is characterized by a fairly wide range of methods, of which the TEACCH and ABA-therapy programs are most widely used and recognized in the world.
The first program is based on the following principles:
- The characteristics of each individual child are interpreted on the basis of observations of him, and not from theoretical ideas;
- increasing adaptation is carried out both by learning new skills and by adapting existing ones to the environment;
- Creation of an individual training program for each child; use of structured learning; holistic approach to intervention.
The second program is largely based on learning, which depends on the consequences that have arisen after the behavior. Consequences can be in the form of punishment or reward. In this model, it is necessary to highlight the main methods, such as the procedure for creating a contour and reinforcing behavior similar to the target; method of teaching chains of behavior; method of teaching discrimination of stimuli.
2) Neuropsychological correction - this type includes a set of exercises consisting of stretching, breathing, oculomotor, facial and other exercises for the development of the communicative and cognitive sphere, and the exercises themselves differ markedly in time and quantity.
3) Work with the child's family and environment - first of all, this type of correction is aimed at alleviating emotional tension and anxiety among family members, since parents of children with ASD often also need help, including psychotherapeutic support and training programs (such programs are mainly aimed at developing feelings of understanding of the problem, the reality of its solution and the meaningfulness of behavior in the current family situation).
4) Psychosocial therapy - in fact, work with the child himself to form the cognitive, emotional and motivational-volitional resources of the individual for the possibility of further social adaptation, the need for which becomes more pronounced as the child with ASD grows older.
5) Logopedic correction - given the fact that speech development disorder is one of the cardinal manifestations of ASD, this type of work with a child will be an integral part of the correction program. It is characterized by a focus on the formation of vocabulary, the development of auditory attention, as well as phonetic and speech hearing.
6) Medical correction of RAS. In some forms of autism, medication is needed for the child. For example, to improve concentration and perseverance, a doctor may prescribe vitamins and nootropic drugs that improve thinking processes and stimulate speech development. And with high impulsivity, aggression, negativism, pronounced signs of "withdrawal into oneself", psychotropic drugs can help.