Diagnostic and statistical manual code
ICD and DSM Coding: What’s the Difference?
There is a lot of talk these days about CMS’ impending required change from ICD-9 to ICD-10. The coming change, due to occur on October 1, 2015, is designed to let medical organizations take advantage of a greatly expanded and much more detailed code set.
ICD was created and is maintained by the World Health Organization (WHO), as the codes are used to communicate medical information worldwide.
Some medical practices and revenue cycle management (RCM) companies, especially those dealing with behavioral health (BH), will also want to know about the differences between ICD and DSM (Diagnostic and Statistical Manual of Mental Disorders) codes.
What is ICD Coding?
ICD includes thousands of codes that medical professionals use to document illnesses and diagnoses, making claims more highly specific in terms of information to insurance companies.
ICD was (and is) developed by WHO, an international organization responsible for updating codes for users worldwide. By having an international standard for such coding, international collaboration is much more effective. We live in an increasingly smaller world, and research done in one country is made more easily applicable in other countries in part due to these universal codes used by practitioners.
What is DSM Coding?
The latest version of the Diagnostic and Statistical Manual of Mental Disorders is DSM-5. It is designed to make the ICD-10 transition go as smoothly as possible for insurance carriers and medical care providers by still using the CM codes (U.S. Clinical Modifications) in the ICD code.
Unlike ICD, DSM is published by the American Psychiatric Association.
Connections Between ICD and DSM
DSM has connections to ICD which are often referred to as “crosswalks” or “bridges.”
Practices or BH settings using DSM can use crosswalks to help practitioners use their DSM codes with ICD codes when submitting claims.
Ultimately, BH providers will need to become familiar with ICD-10 codes and learn how to use bridges or crosswalks between the DSM codes and the ICD codes.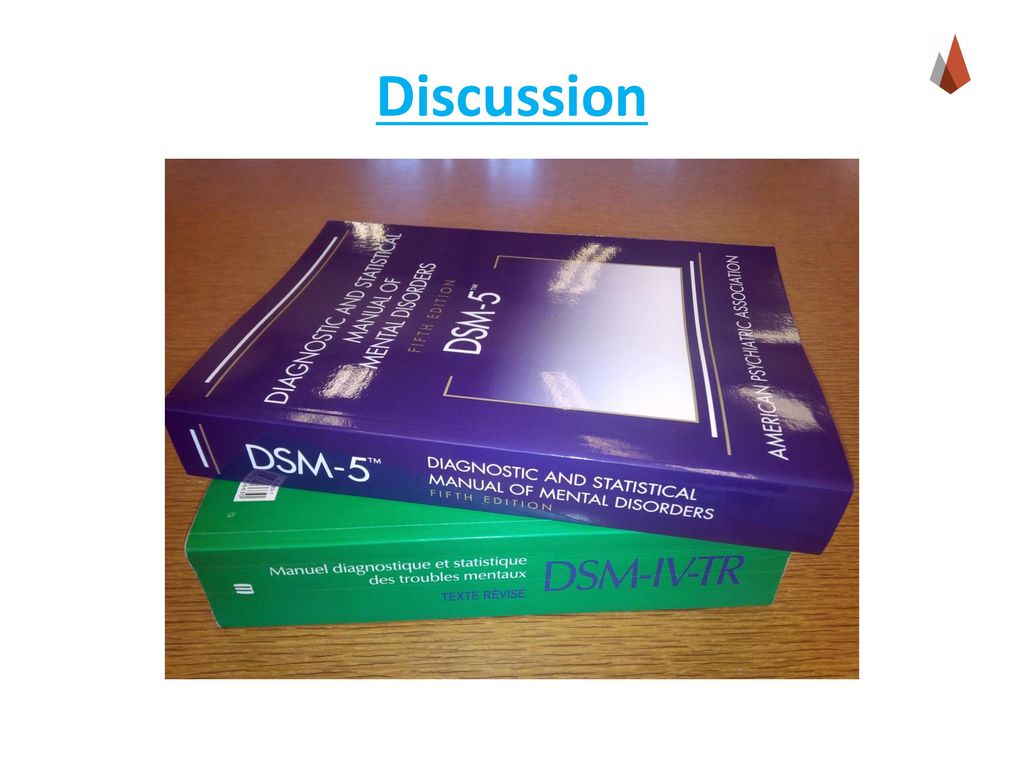
BH providers will benefit from training and practice to help them with their documentation as the entire medical community switches to ICD-10 on October 1, 2015.
It’s also worth noting that that the WHO has published the ICD-10 Classification of Mental and Behavioral Disorders Clinical Descriptions and Diagnostic Guidelines (aka “blue book”) to help BH providers determine diagnoses.
Medical practices and RCM companies will need to get ready for the upcoming transition to ICD-10 from ICD-9. Those that work with DSM codes should know DSM codes can be used in making their diagnoses, but because DSM codes are not HIPAA compliant, the appropriate ICD code(s) will be needed for documentation.
As BH providers become more familiar with ICD-10, they will be able to more easily enter the correct codes from their DSM-based assessments.
Key Takeaway:
- ICD-9 is transitioning to ICD-10 on October 1, 2015. The last day for ICD-9 is September 30, 2015.
- Connections exist between the latest version DSM-5 and the ICD-10 code set.
- DSM codes are not HIPAA-compliant, which means ICD-10 codes will be needed for claims.
- The American Psychiatric Association is establishing “crosswalks” or “bridges” to help in using DSM-5 to support their diagnoses as they enter the proper ICD-10 codes which are needed for HIPAA compliance.
Information in ADSC Blogs is presented according to our best understanding of the subject as derived from sources such as CMS. Any uncertainty on the part of the reader, or any clarifications that may be required should be researched as needed by the reader.
Photo Courtesy of: freedigitalphotos.net
Diagnostic Criteria | Autism Spectrum Disorder (ASD) | NCBDDD
The American Psychiatric Association’s Diagnostic and Statistical Manual, Fifth Edition (DSM-5) provides standardized criteria to help diagnose ASD.
To meet diagnostic criteria for ASD according to DSM-5, a child must have persistent deficits in each of three areas of social communication and interaction (see A.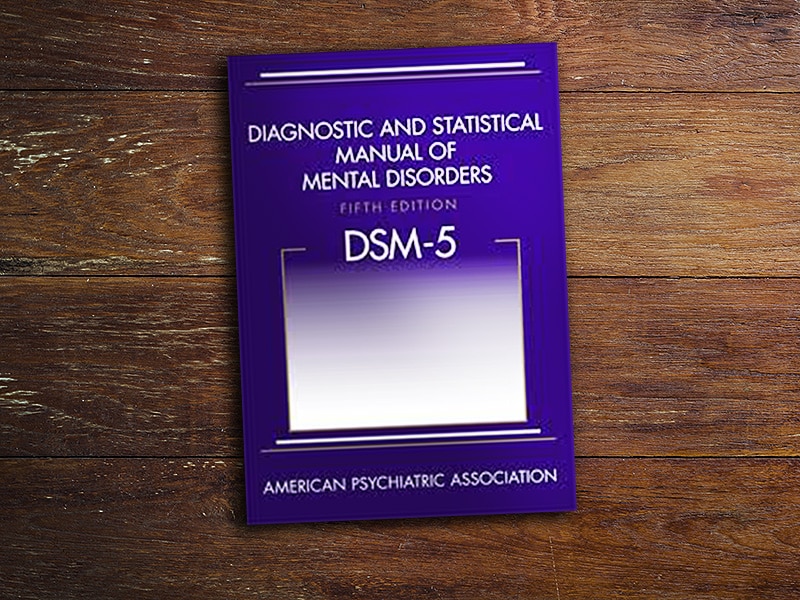 1. through A.3. below) plus at least two of four types of restricted, repetitive behaviors (see B.1. through B.4. below).
- Persistent deficits in social communication and social interaction across multiple contexts, as manifested by the following, currently or by history (examples are illustrative, not exhaustive; see text):
- Deficits in social-emotional reciprocity, ranging, for example, from abnormal social approach and failure of normal back-and-forth conversation; to reduced sharing of interests, emotions, or affect; to failure to initiate or respond to social interactions.
- Deficits in nonverbal communicative behaviors used for social interaction, ranging, for example, from poorly integrated verbal and nonverbal communication; to abnormalities in eye contact and body language or deficits in understanding and use of gestures; to a total lack of facial expressions and nonverbal communication.
- Deficits in developing, maintaining, and understanding relationships, ranging, for example, from difficulties adjusting behavior to suit various social contexts; to difficulties in sharing imaginative play or in making friends; to absence of interest in peers.

Specify current severity:
Severity is based on social communication impairments and restricted, repetitive patterns of behavior. For either criterion, severity is described in 3 levels: Level 3 – requires very substantial support, Level 2 – Requires substantial support, and Level 1 – requires support..1
- Restricted, repetitive patterns of behavior, interests, or activities, as manifested by at least two of the following, currently or by history (examples are illustrative, not exhaustive; see text):
- Stereotyped or repetitive motor movements, use of objects, or speech (e.g., simple motor stereotypes, lining up toys or flipping objects, echolalia, idiosyncratic phrases).
- Insistence on sameness, inflexible adherence to routines, or ritualized patterns of verbal or nonverbal behavior (e.g., extreme distress at small changes, difficulties with transitions, rigid thinking patterns, greeting rituals, need to take same route or eat same food every day).
- Highly restricted, fixated interests that are abnormal in intensity or focus (e.g., strong attachment to or preoccupation with unusual objects, excessively circumscribed or perseverative interests).
- Hyper- or hyporeactivity to sensory input or unusual interest in sensory aspects of the environment (e.g. apparent indifference to pain/temperature, adverse response to specific sounds or textures, excessive smelling or touching of objects, visual fascination with lights or movement).
Specify current severity:
Severity is based on social communication impairments and restricted, repetitive patterns of behavior. For either criterion, severity is described in 3 levels: Level 3 – requires very substantial support, Level 2 – Requires substantial support, and Level 1 – requires support..1
- Symptoms must be present in the early developmental period (but may not become fully manifest until social demands exceed limited capacities, or may be masked by learned strategies in later life).
- Symptoms cause clinically significant impairment in social, occupational, or other important areas of current functioning.
- These disturbances are not better explained by intellectual disability (intellectual developmental disorder) or global developmental delay. Intellectual disability and autism spectrum disorder frequently co-occur; to make comorbid diagnoses of autism spectrum disorder and intellectual disability, social communication should be below that expected for general developmental level.
Note: Individuals with a well-established DSM-IV diagnosis of autistic disorder, Asperger’s disorder, or pervasive developmental disorder not otherwise specified should be given the diagnosis of autism spectrum disorder. Individuals who have marked deficits in social communication, but whose symptoms do not otherwise meet criteria for autism spectrum disorder, should be evaluated for social (pragmatic) communication disorder.
Specify if:
With or without accompanying intellectual impairmentWith or without accompanying language impairment
Associated with a known medical or genetic condition or environmental factor
(Coding note: Use additional code to identify the associated medical or genetic condition.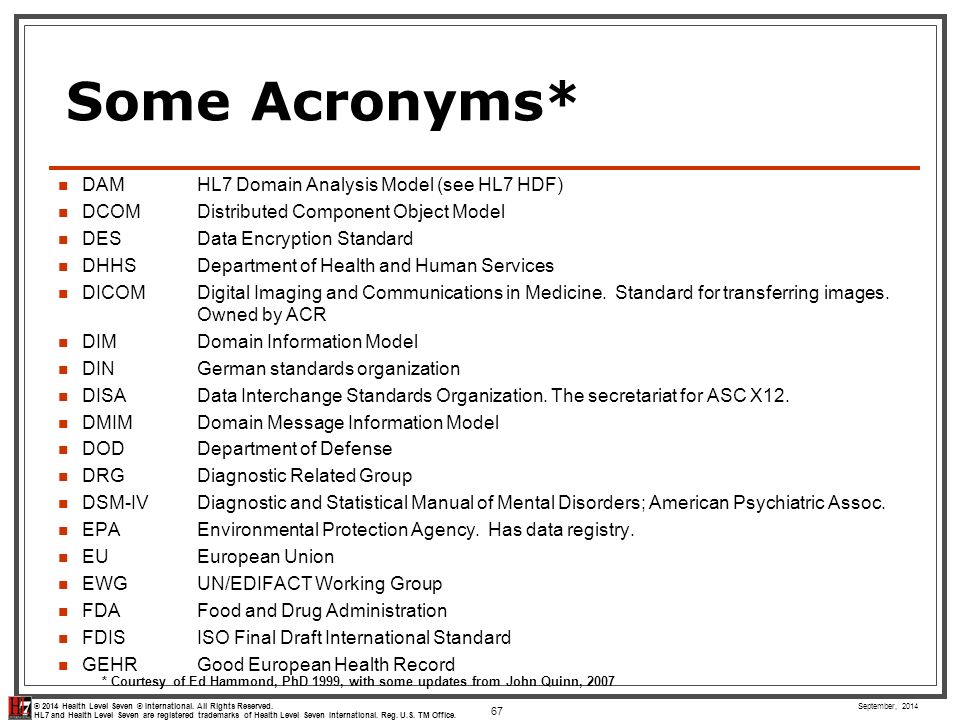 )
)
Associated with another neurodevelopmental, mental, or behavioral disorder
(Coding note: Use additional code[s] to identify the associated neurodevelopmental, mental, or behavioral disorder[s].
With catatonia (refer to the criteria for catatonia associated with another mental disorder)
(Coding note: Use additional code 293.89 catatonia associated with autism spectrum disorder to indicate the presence of the comorbid catatonia.)
References
- American Psychiatric Association. Diagnostic and statistical manual of mental disorders. 5th ed. Arlington, VA: American Psychiatric Association; 2013.
| 73/2022 | Order of Rosstandart dated 11.11.2022 No. 1241-st | 01.12.2022 | V A | 900072 7222 /2022 | Order of the Rosstandart dated 08. 30.2022 No. 849-st 30.2022 No. 849-st | 01.10.2022 | in a | 71/2022 | dated 07.26.2022 No. 693-st | 01/01/09.2022 | and |
| 70/2022 | Order of the Rosstandart dated 07.26.2022 No. 692-st | 01.09.2022 | in and | |||||||
| 69/2022 | 9000 -ST01.09.2022 | B | ||||||||
| 68/2022 | Order of Rosstandart dated 06.21.2022 No. 486-ST | 01.08.2022 | V and | 67/2022 | dated 05/26/2022 No. 387-st | 01.07.2022 | B A and | |||
| 66/2022 | Order of Rosstandart dated 04/27/2022 No. 235-ST | 07.07.2022 | V and | 65/2022 | 9000 04.02.2022 No. 58-ST | 01.03.2022 | B A | |||
| 64/2021 | Order of Rosstandart dated 23.12.2021 No. 1850-st | 01.02.2022 | V A and | 63 63 63 63 63 /2021 | Order of Rosstandart dated 07. 12.2021 No. 1734-ST 12.2021 No. 1734-ST | 01.01.2022 | B A and | |||
| 62/2021 | Order of Rosstandart dated 07.12.2021 No. 1733-ST 9000.01.2022 | 9000 | ||||||||
| 61/2021 | Order of Rosstandart dated 07.10.2021 No. 1084-st | 01.12.2021 | V and | 60/2021 | Order of the Rosstandart dated 07.10.2021 No. 1083-st | 01.12.2021 | B A | |||
| 59/2021 | Order of Rosstandart dated 12.08.2021 No. 710-ST | 01.09.2021 | in | 58/2021 | 9000.202.2021 No. 562-T | 01.07. 2021 | V and | |||
| 57/2021 | Order of Rosstandart dated 10.06.2021 No. 532-st | 01.07.2021 | B A and | |||||||
| 56/2021 | 9000 423-st01.07.2021 | V A and | ||||||||
| 55/2021 | Order of Rosstandart dated 04/27/2021 No. 303-ST | 01.06.2021V and | 54/2021 | 12.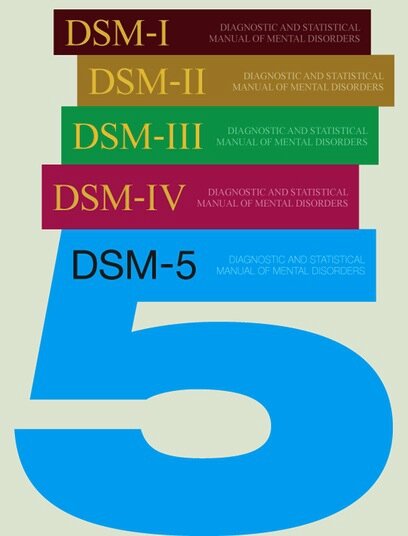 04.2021 No. 202-st 04.2021 No. 202-st | 01.06.2021 | in | ||||
| 53/2021 | Order of Rosstandart dated 12.04.2021 No. 1 | 01.06.2021 | 52/ 2021 | Order of Rosstandart dated 12.04.2021 No. 196-st | 01.06.2021 | in A | ||||
| 51/2021 | Order of Rosstandart dated 10.02.2021 No. 68-st | 01.03.2021 | V and | |||||||
| 50/2021 | Order of the Rosstandart dated 10.02.2021 No. 67-st | 01.03.2021 | V A and | 49/2020 | Order of Rosstandart dated December 29 ,2020 No. 1426-st | 01.02.02. 2021 | and | |||
| 48/2020 | Order of the Rosstandart dated 02.12.2020 No. 1242-st | 09.01.2021 | in A and | 47/2020 | 9000.2013.2020 No. 663-ST | 01.11.2020 | V and | |||
| 46/2020 | Order of Rosstandart dated 08. 27.2020 N 549-st 27.2020 N 549-st | 01.10.2020 | in A and | 45/2020 | Order of the Federal Standard of 01.06. 2020 N 247-st | 01.06.2020 9000. .2020 No. 58-ST | 01.03.2020 | B | ||
| 42/2020 | Order of Rosstandart dated 11.02.2020 No. 55-ST | 01.03.2020 | 9000Order of Rosstandart dated 24.12.2019 No. 1463-st | 01.01.2020 | in | |||||
| 39/2019 | Order of Rosstandart dated 11/14/2019 No. 1145-ST | 01.12.2019 | A and Ir | |||||||
| 38/2019 | Order of Rosstandart dated 09/27/2019 No. 809-st | 01.01.2020 | V A and | 37/2019 | Order of the Federal Standard dated 09/18/2019 No. 711-st | 01.10. 2019 | and | |||
| 36/2019 | Order of Rosstandart dated 17.07.2019 No. 401-st | 08/01/2019 | and | 34/2019 | Order of Rosstandart dated 02. 20.2019 No. 46-st 20.2019 No. 46-st | 01.05 05. 2019 | A and | 33/2018 | Order of Rosstandart dated December 29, 2018 No. 1190-st | 01.01.2020 | V A and |
| 32/2018 | Order of the Federal Standard dated 10.24.2018 No. 842-st | 01/01/2019 | in a | 31/2018 | Order of Rosstandart dated 10.10.2018 No. 784-st | 01.11.2018 | V and | 30/2018 | 9000 .2018 No. 407-st01.10.2018 | in A and IR |
| 29/2018 | Order of Rosstandart dated 10.07.2018 No. 406-st | 01.10.2018 | V A and | |||||||
| 28/2018 | Order of Rosstandart dated 03.29.2018 No. 159-st | 06/01/2018 | V and | |||||||
| 27/2018 | Order of Rosstandart dated 13.02.2018 No. 66-st | 01.04.2018 | in | |||||||
| 26/2018 | Order of the Rosstandart dated 01. 30.2018 No. 36-st 30.2018 No. 36-st | 04/01/2018 | V A and | 04/2017 | Rosstandart order dated 21.02.2017 No. 2049-ST | 01.03. 2018 | in A and | |||
| 24/2017 | Order of Rosstandart dated December 21, 2017 No. 2047-st | 03/01/2018 | B and | /2017 | Order of Rosstandart dated 12.12.2017 No. 2045- ST | 03/01/2018 | V A and | |||
| 22/2017 | Order of Rosstandart dated 08.09.2017 No. 791-ST | 01.12.2017 | V A and | 21/2017 9000 Rosstandart from 08.09.2017 No. 1044-st | 01/01/2017 | in A and IR | ||||
| 20/2017 | Order of Rosstandart dated 03.08.2017 No. 791-ST | 01.11.2017 | V A and | |||||||
| 19/2017 | Order of Rosstandart dated 03/03/2017 No. 347-st | 07/01/2017 | in A and | |||||||
| 18/2016 | Order of the Rosstandart dated 10/07/2016 N 1326-st | 01/01/2017 | V I | |||||||
| 17/2016 | Order of Rosstandart dated 07. 10.2016 No. 1325-st 10.2016 No. 1325-st | 01/01/2017 | and | |||||||
| 16/2016 | Rosstandard order dated 07.10.2016 No. 1324-st | 01/01/2017 | B and | |||||||
| 15/2016 | Order of Rosstandart dated 09/28/2016 No. 1239-ST | 01/01/2017 | V and | /2016 | Order of the Rosstandart dated 09/28/2016 No. 1238-SS | 01.01.2017 | B A and | |||
| 13/2016 | Order of Rosstandart dated 09/28/2016 No. 1237-st | 01.01.01.2017 | V A and | |||||||
| 12/2016 | Order of Rosstandart dated 08/26/2016 No. 948-ST | 01.11.2016 | B A and | |||||||
| 11/2016 | Order of Rosstandart dated 06.24.2016 No. 679-ST | 09/01/2016 | V A and | 9000/2016 | Order of Rosstandart dated May 12, 2016 No. 311-st | 07/01/2016 | V A and | |||
| 9/2016 | Order of Rosstandart dated 05/12/2016 No. 310-ST 310-ST | 07/01/2016 | 06/01/2016 | V A and | ||||||
| 7/2016 | Order of Rosstandart dated 03.24.2016 No. 200005 | 06/01/2016 | V A and | |||||||
| 6 /2016 | Order of Rosstandart dated 17.02.2016 No. 40-ST | 06/01/2016 | V A and | |||||||
| 5/2015 | Order of Rosstandart dated 12.12.2015 N 2149-st | 03/01/2016 | V A||||||||
| 4/2015 | Order of Rosstandart dated 10.12.2015 N 2148-st | 03/01/2016 | and | 3/2015 | Rosstandart dated 11/26/2015 No. 1999-T | 01.11.2015 | V I | |||
| 2/2015 | Order of Rosstandart dated 08/17/2015 No. 1166-st | 01.11.2015 | in and | 1/2015 | Order of Rosstandart dated 05/26/2015 No. 424-st | 9000 .2015 | AND |
Sorting static analyzer warnings by priority when finding and fixing software bugs / Sudo Null IT News0718 ,
NVD ) 6,488 new software vulnerabilities were registered, for a total of 74,885 vulnerabilities found in the period 1988-2016. Static analysis tools check the source code of programs for defects, including potential security vulnerabilities, and issue diagnostic messages (warnings) that indicate the location of the alleged defect, its nature, and, as a rule, additional contextual information. The validity of such warnings is then evaluated by the user. The labor involved in checking all warnings and manually fixing all confirmed errors often far exceeds the project's budget and timeline. For this reason, users need tools to sort alerts by severity, thereby determining the order in which they are reviewed. This paper focuses on our study of this issue, using classification models to help analysts and programmers classify warnings by priority and determine the best order in which to fix the corresponding errors. nine0721
 Static analyzer warnings: problems and main task
Static analysis tools check applications without running them, unlike dynamic analysis tools. Static analysis usually checks the source files of a program, although binary files can also be checked.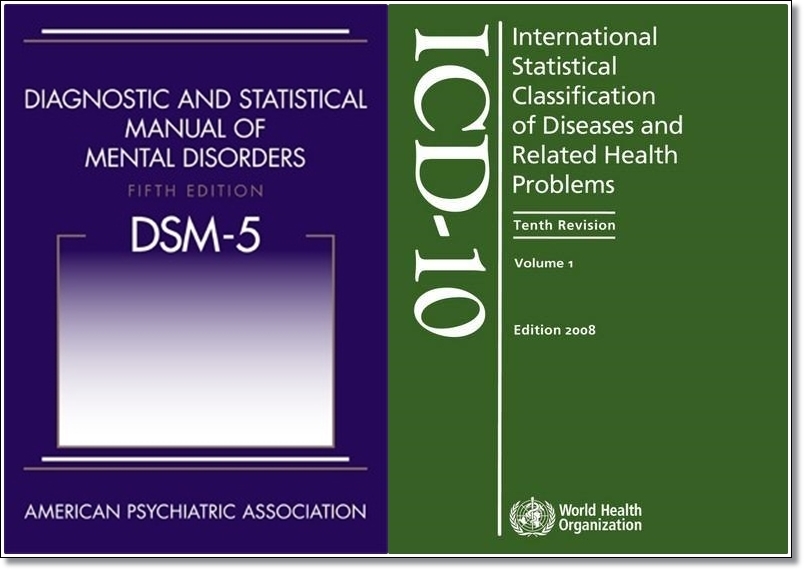 The output of such tools is a set of warnings that at least contain information about the location of the defect in the source code (for example, the file path and line number), as well as a textual description of the problem. Many analyzers also provide additional contextual information, such as information about the execution branches of the code section being examined and the values of variables that can trigger this diagnostic. In case of errors that affect several lines of code at once, in some static analyzers the warning indicates the start and end lines. nine0721
Some of the warnings may turn out to be false positives (false positives), which are erroneously issued to the correct code and are due to the trade-off between accuracy and speed of checking, which is inevitable for static analysis. In particular, the analyzer may be forced to produce inaccurate results in order to meet reasonable deadlines and an acceptable amount of computing resources. Some static analyzers, such as automatic theorem proving tools like Z3, focus on analysis accuracy at the expense of performance. In addition to false positives, static analyzers can also show false negatives (i.e., when warnings are not issued for erroneous code). In some cases, this behavior is due to the fact that the tool simply does not know how to detect certain types of errors. nine0721
Permissible correlations between the speed and accuracy of the analysis were agreed during discussions between the developers of static analyzers (both closed and open), as a result of which the optimal number of warnings issued was determined, which would allow detecting real errors without generating too many false positives. On the subject of how difficult these discussions were, there is a noteworthy article by Al Bessie of Coverity: A Few Billion Lines of Code Later: Using Static Analysis to Find Bugs in the Real World .
A previous study found a decrease in the match between the types of defects detected by the most popular tools. On the one hand, this is explained by the fact that developing a static analyzer from scratch is a time-consuming task, and manufacturers simply cannot include all types of analysis at once. On the other hand, diagnostics for some types of errors require a lot of memory, analysis time, or disk space. Such diagnostics are not included in the tool if they are in low demand among users. nine0721
By checking the codebase with multiple analyzers at once, users can identify a wider range of issues, allowing for deeper analysis. However, this approach leads to the accumulation of too many warnings to be checked, including false positives.
According to the empirical data obtained by Kremenek et al., analyzers that are able to effectively detect software errors have false positives of 30% or more of the total number of warnings they issue. Our task, therefore, is to achieve the maximum possible automation of the process of establishing the truth / falsity of warnings. We also determine the severity of alerts that require user review to make it easier to prioritize alerts. nine0721
Our approach
Other authors' studies on the problem of combining warnings from different instruments and their evaluation - [Meng 2008], [Kong 2007], [Kremenek 2004a] and [Plakosh 2014] - rely on statistical methods that do not take into account complex potential correlations between different factors (for example, take into account fewer classification features and/or use simpler mathematical models) or do not provide a detailed description for warnings from several tools. At the same time, there are many works that explore the issue of classifying warnings of any one tool and use methods for sorting them by priority based on the same features that are taken into account in our classification models. Examples of such articles are [Heckman 2011], [Ruthruff 2008], [Kremenek 2004b] and [Heckman 2007]. nine0721
The authors of previous studies were able to accurately determine the degree of reliability of the warnings of individual analyzers and, based on this indicator and a number of other factors, classify them by priority. Thus, the authors of study Predicting Accurate and Actionable Static Analysis Warnings: An Experimental Approach developed models that correctly identified false positives among FindBugs static analyzer warnings in more than 85% of cases. Evaluable alerts were sorted by priority based on dynamically updated data about whether acknowledged bugs of one type or another have been fixed in the past. Previous studies have used methods such as collecting contextual information about the code, choosing warning types, data fusion, machine learning, and mathematical and statistical models to solve the problem of differentiating between false and real errors. All these methods and mechanisms are used in our study. In addition, we apply dynamic defect detection technology, graph theory and model verification mechanism. Based on the work of other researchers, we have combined many classification features corresponding to the warning parameters and the code itself. nine0721
Our approach also takes into account the experience of the study conducted by the Carnegie Mellon Software Engineering Institute ( Software Engineering Institute , SEI ), Improving the Automated Detection and Analysis of Secure Coding Violations [Plakosh 2014], which resulted in the development of three binary logistic regression models for classifying warnings (warnings were taken as a basis for which there are matches in the SEI CERT Secure Programming Standards database) - these models take into account in which analyzers this or that diagnostic worked. In other words, for three rules from the SEI CERT Secure Programming Standards, the authors of the study developed classifiers, which were then “trained” on a set of already verified warnings from several tools. Next, these classifiers were tested on a different set of warnings, with each classifier having to evaluate them as true or false, after which the accuracy of the predictions was compared with real manual evaluation data. In this work, for the first time, advanced methods for statistical analysis of a set of warnings from different static analyzers were proposed, which make it possible to predict the truth/falsehood of a particular warning as accurately as possible. nine0721
In our study, we complement the work of the SEI by introducing a mechanism for evaluating additional classification methods and using a much larger number of classification features. In addition, the data set analyzed by us differs 6 o in its large volume and heterogeneity. We have developed classifiers for rules, as well as an initial classifier that uses the SEI CERT rule identifier format (it includes a 3-letter prefix indicating the type of rule, a number, a hyphen, and the name of the programming language, for example: "INT33-C") as another sign of classification. We continue to improve our classification models by trying different classifier parameters, adding new data to the alert sets on which the models are trained and tested, and experimenting with the input data sets while developing the classifiers. Once the classifier is ready, we apply it to the corresponding warnings in the test set in order to evaluate the prediction accuracy of our models. The novelty of our approach lies in the fact that we use several analyzers, take into account more features and apply a number of advanced classification methods, from which the most productive ones are selected. nine0721
The SEI research team that is helping me with this project includes David Svoboda, Will Snavely, Robert Stodard, David Zubrow, Jennifer Burns, Guillermo Marse-Santurio, Eli Kanal, Christine Beck, and Richard Chin. Our team collaborates with Claire Le Goux, senior lecturer at Carnegie Mellon University's School of Computer Science ( CMU's School of Computer Science ), who acts as a consultant. Her experience is extremely useful for our project, since she is engaged in research in the field of software engineering and programming languages, namely, she specializes in the development, debugging and quality assurance of software systems. Our study also responds to the challenges set by the Department of Defense in connection with the need for technology for operational, assisted and automated analysis and verification of applications. In addition, our study is consistent with one of the two objectives of the SEI strategic plan: ensuring the security of software-dependent systems throughout their entire life cycle. nine0721
Our approach will allow analysts and programmers to sort alerts by severity by automating the following processes:
- Determining the confidence level of an alert (ie, the likelihood that a particular alert is true or false).
- Distribution of alerts into three categories: Inferred True Alerts (e-TP), Inferred False Positives (e-FP) and Intermediate (I).
 At the same time, warnings of the first group (e-TP) are immediately sent to debuggers after detection, bypassing manual checking. nine0766
 - Sort intermediate warnings based on their confidence level. This may also take into account additional factors that are relevant to this alert, such as the risks and costs associated with processing it.
When developing a classifier for a rule from the SEI CERT Secure Programming Standards, we use historical data for all checked warnings related to this rule, as well as new data collected as part of this project. Similarly, archive and new data are taken into account when creating a classifier for the entire set of warnings. nine0721
Based on the experience of the studies mentioned above (both inside and outside the SEI), we have identified the following classification features for inclusion in our models (non-exhaustive list):
 )
) Processing of archived data on checked alerts and corresponding signs from the list is carried out using four classification methods:
- Nominal logistic regression
- CART algorithm (building a decision tree)
- Random Forest algorithm
- Information theory supervised learning
One of the datasets used in our study includes warning evaluation results for 20 source code bases totaling 19,237 KLOC ( thousand lines of code ) and contains 3,147 confirmed real warnings and 11,772 confirmed false positives. nine0721
To test these databases, we used the Source Code Analysis Laboratory (SCALe) CERT tool, a software platform that combines the analysis tools of a number of commercial, open and experimental tools. Due to the fact that SCALe uses the power of several static analyzers, it detects more defects than any single tool. However, this approach implies a large amount of output data and, accordingly, requires large labor costs for their processing. In total, more than 16 million lines of code were analyzed using SCALe, including source code bases of the Ministry of Defense, power supply systems, medical equipment, etc. nine0721
Using the SCALe GUI, the user loads a set of static analyzer reports and the corresponding source files into the tool. Warnings are stored in a single format in a separate SCALe database. Each warning is accompanied by additional information, such as information about the corresponding rule from the CERT Secure Programming Standards set. SCALe also maintains associations between these rules and warnings from each of the connected analyzers, so that the same CERT rule can correspond to several warnings from different tools. These associations between warnings and rules are of particular importance to our task of classifying warnings at the level of individual rules. nine0721
The application can also be used to study warnings. The web browser-based interface allows you to filter warnings and sort them by priority, view the corresponding section of source code, and mark warnings as true or false. The database is dynamically updated as changes are made.
We've improved SCALe for our project so that it can collect additional information on each alert and perform a number of auxiliary tasks, such as anonymizing the data. Additional information is drawn from several sources. Source code metrics (such as cyclomatic complexity and number of significant lines of code) are calculated using a modified version of the Lizard tool. Fields for additional parameters are retrieved from analyzer reports. nine0721
In addition, we have developed a script that combines and analyzes alerts, preparing the data for processing by statistical analysis applications. This script converts a modified version of SCALe's multi-table database into a comma-separated linear .csv file, a format useful for classification tools. Our script also merges warnings that match the parameters [rule, line number, file]. Finally, the script performs additional analysis and adds information such as the number of warnings per file, the number of warnings per function, and the depth of file nesting in the project to the records, and splits the file paths so that overlapping paths can be used as classification criteria. nine0721
Our classifier development method can be easily extended to work with other standards and platforms capable of storing test data. For example, the CERT programming rules can be replaced by other similar standards, and the SCALe tool by other platforms. The associations of warnings with rules stored in SCALe can be replaced with associations with other rules and numbered lists of errors, for example, the Common Catalog of Software Vulnerabilities ( Common Weakness Enumeration ), the OWASP Application Security Verification Standard ( OWASP Application Security Verification Standard Project ), and the MISRA C Software Development Standard. Similarly, warning evaluation data from other multi-analyzer platforms can be converted to other formats supported by our classifiers and their development tools.
Testing our approach with DoD partners
In addition to the 20 codebases verified by CERT, we use data from three departments of the Department of Defense (we will discuss this type of cooperation in a separate article), two of which declared the need to check the security of their code with more than 100 MSLOC ( million significant lines of code ). Extrapolating from the results gathered from historical data from previous CERT reviews (at a rate of 3.31 warnings per 1,000 lines of code), we expect to be able to identify approximately 662,000 warnings for both divisions' codebases. Our task is to automatically determine the truth/falsity of the marked defects with an accuracy of 95%. If successful, our method (and the analyzers created on its basis) will help to significantly reduce labor costs for evaluating the results of the analysis and sorting the found defects by priority. nine0721
Using our automatic classification system, experts in the departments mentioned could process warnings in the following way:
- e-TP (suspected true errors) are sent directly to the debugging team.
- I (interim warnings) sent to the analysis team for evaluation.
- e-FP (suspected false positives) are ignored. nine0771
- with special permission from the Software Engineering Institute. nine0974
- Neither Carnegie Mellon University nor its Software Engineering Institute participated in the creation of this translation, and accordingly, they do not directly or indirectly endorse it. Accuracy and interpretation of this translation are the responsibility of Andrey Karpov.
- ANY MATERIAL OF CARNEGIE MELLON UNIVERSITY AND/OR ITS SOFTWARE ENGINEERING INSTITUTE CONTAINED HEREIN IS FURNISHED ON AN "AS-IS" BASIS.
Further extrapolation of the archived CERT data yields a true/false warning ratio of 1:3.74. Thus, given our ambitious goal of processing 90% of warnings and correctly distributing them into groups e-TP and e-FP , the following results are expected for 200 MSLOC: 126,000 e-TP , which will be immediately sent to the team debuggers, 470,000 e-FP which will be ignored, and 66,000 I which will be evaluated manually. These figures assume a reduction in the time for manually evaluating alerts by 90%, all warnings will be taken into account, so that the security level of the code will not be reduced (in other words, 90% of automatically identified e-TP - or e-FP - warnings correspond to a 90% reduction in the time to evaluate them manually ). The confidence level of interim warnings will help determine how they are reviewed. In practice, those with the lowest priority may be ignored altogether.
The figure below shows how our method can improve the application review process. Codebases are checked by several static analyzers, and each of them issues its own set of warnings. The arrows under "Today" from the "Alerts" block to the red-bordered chart indicate the usual strategy for handling alerts, in which each alert and its corresponding code must be manually reviewed to determine its true or false.This process tends to be too time consuming given the limited budget of the projects.The yellow circle in this chart shows the number of warnings that can be scored for 12.939 hours of work (assuming each alert typically takes 5 minutes, according to a study [Hayward, 2008]), and the red ellipse represents the remaining 506,733 unchecked alerts. On the other hand, our strategy is shown by the top row of arrows: 90% of alerts will be automatically and correctly assigned to groups e-TP or e-FP , leaving the user with only 66,000 intermediate alerts to check. This will only take 5,500 hours, which is less than half the time for the first scenario. Moreover, our method guarantees that all warnings that require manual checking will definitely pass it. nine0721
Fig. 1: The objective of our study is to significantly reduce the time for manually evaluating unchecked warnings and their number. The image of a woman and a laptop ("Woman And Laptop") is taken from the following source: www.publicdomainpictures.net/view-image.php?image=47526&picture=woman-and-laptop .
Further work
In the recently published study Automatically Learning Semantic Features for Defect Prediction , it was shown that the analysis of the semantic features of programs can significantly improve the accuracy of detecting software defects. In this regard, we plan to subsequently add such an analysis to our classification models. Moreover, we expect to use semantic features from reports stored in repositories when developing classifiers. We are also going to use the automatic parameter optimization mechanism for classification methods, which, according to the results of a recent study Automated Parameter Optimization of Classification Techniques for Defect Prediction Models will greatly improve our classifiers.
In the future, we may also add advanced analysis of the costs, risks, and benefits of checking alerts and consider these metrics along with confidence in determining the sensitivity of our classification models. This approach will increase the likelihood of their adoption in software companies.
Our system supports any CERT programming rules, and in the future we plan to develop classifiers for other standards as well. At the moment, we are limited by the set of analyzers used and the readiness of potential consumers to purchase and maintain several tools.
It is also possible that in the future the results of our research will be merged with code auto-correction solutions currently being worked on at SEI. In this case, our models will apply after automatic refactoring of the code, which will help to eliminate only a small number of warnings about potential errors. Our method can be used to prioritize (with peer review) potential semi-automated fixes that are not guaranteed to be correct and require manual evaluation (e.g., an expert should determine whether some auto fix would be correct given the desired behavior codes). All other alerts for which there are no automatic fixes can be classified in the normal way using our method as described above (i.e. categorized as e-TP , e-FP and I ).
In the next article in this series, we will talk about our team's collaboration with the three departments of the Department of Defense mentioned above.
We would love your feedback on this work - leave them in the comments section under the text. nine0721
Additional resources
Read and comment on our articles and help us improve the SEI CERT Programming Standards, which are developed on the basis of public wikis.
We also invite you to visit the website of the CERT Source Code Analysis Lab.
The following are sources for citations in this article:
[Heckman 2011] Heckman, Sarah, and Laurie Williams. A systematic literature review of actionable alert identification techniques for automated static code analysis . Information and Software Technology 53.4 (2011): 363-387.
[Heckman 2007] Heckman, Sarah. Adaptively ranking alerts generated from automated static analysis , Crossroads 14.1, 2007.
[Kong 2007] Kong, Deguang, et al. ISA: a source code static vulnerability detection system based on data fusion . Proceedings of the 2nd international conference on Scalable information systems. ICST, 2007.
[Kremenek 2004] Kremenek, Ted, et al. Correlation exploitation in error ranking. ACM SIGSOFT Software Engineering Notes. Volume 29. N6. ACM, 2004.
[Meng 2008] N. Meng, Q. Wang, Q. Wu, H. Mei, An approach to merge results of multiple static analysis tools , Proceedings of the Eight International Conference on Quality Software, Oxford , UK, August 12-13, 2008.
[Plakosh, 2014] Plakosh, Daniel, Robert Seacord, Robert W. Stoddard, David Svoboda, and David Zubrow. Improving the Automated Detection and Analysis of Secure Coding Violations . (2014).
[Ruthruff 2008] Ruthruff, Joseph R., et al. nine0717 Predicting accurate and actionable static analysis warnings: an experimental approach . Proceedings of the 30th international conference on Software engineering. ACM, 2008.
Translation Acknowledgments